Secoda Docs
Get Started
  • Getting Started with Secoda
    • Secoda as an Admin
      • Deployment options
      • Sign in options
      • Settings
      • Connect your data
        • Define Service Accounts
        • Choose which schemas to extract
      • Customize the workspace
      • Populate Questions with FAQs
      • Invite your teammates
        • Joining & Navigating between Multiple Workspaces
      • Onboard new users
        • Onboarding email templates
        • Onboarding Homepage template
        • Training session guide
      • User engagement and adoption
        • Tips & Tricks to share with new users
    • Secoda as an Editor
    • Secoda as a Viewer
      • Introduction guide
      • Requesting changes in Secoda
  • Best practices
    • Setting up your workspace
    • Integrating Secoda into existing workflows
    • Documentation best practices
    • Glossary best practices
    • Data governance
    • Data quality
    • Clean up your data
    • Tool migrations using Secoda
    • Slack <> Questions workflow
    • Defining resources workflow
    • Streamline data access: Private and public teams workflow
    • Exposing Secoda to external clients
  • Resource Management
    • Editing Properties
      • AI Description Editor
      • Bulk Editing
      • Propagation
      • Templates
    • Resource Sidesheet
    • Assigning Owners
    • Custom Properties
    • Tags
      • Custom Tags
      • PII Identifier
      • Verified Identifier
    • Import and Export Resources
    • Related Resources
  • User Management
    • Roles
    • Teams
    • Groups
  • Integrations
    • Integration Settings
    • Data Warehouses
      • BigQuery
        • BigQuery Metadata Extracted
      • Databricks
        • Databricks Metadata Extracted
      • Redshift
        • Redshift Metadata Extracted
      • Snowflake
        • Snowflake Metadata Extracted
        • Snowflake Costs
        • Snowflake Native App
      • Apache Hive
        • Apache Hive Metadata Extracted
      • Azure Synapse
        • Azure Synapse Metadata Extracted
      • MotherDuck
        • MotherDuck Metadata Extracted
      • ClickHouse
        • ClickHouse Metadata Extracted
    • Databases
      • Druid
        • Druid Metadata Extracted
      • MySQL
        • MySQL Metadata Extracted
      • Microsoft SQL Server
        • Page
        • Microsoft SQL Server Metadata Extracted
      • Oracle
        • Oracle Metadata Extracted
      • Salesforce
        • Salesforce Metadata Extracted
      • Postgres
        • Postgres Metadata Extracted
      • MongoDB
        • MongoDB Metadata Extracted
      • Azure Cosmos DB
        • Azure Cosmos DB Metadata Extracted
      • SingleStore
        • SingleStore Metadata Extracted
      • DynamoDB
        • DynamoDB Metadata Extracted
    • Data Visualization Tools
      • Amplitude
        • Amplitude Metadata Extracted
      • Looker
        • Looker Metadata Extracted
      • Looker Studio
        • Looker Studio Metadata Extracted
      • Metabase
        • Metabase Metadata Extracted
      • Mixpanel
        • Mixpanel Metadata Extracted
      • Mode
        • Mode Metadata Extracted
      • Power BI
        • Power BI Metadata Extracted
      • QuickSight
        • QuickSight Metadata Extracted
      • Retool
        • Retool Metadata Extracted
      • Redash
        • Redash Metadata Extracted
      • Sigma
        • Sigma Metadata Extracted
      • Tableau
        • Tableau Metadata Extracted
      • ThoughtSpot
        • ThoughtSpot Metadata Extracted
      • Cluvio
        • Cluvio Metadata Extracted
      • Hashboard
        • Hashboard Metadata Extracted
      • Lightdash
        • Lightdash Metadata Extracted
      • Preset
        • Preset Metadata Extracted
      • Superset
        • Superset Metadata Extracted
      • SQL Server Reporting Services
        • SQL Server Reporting Services Metadata Extracted
      • Hex
        • Hex Metadata Extracted
      • Omni
        • Omni Metadata Extracted
    • Data Pipeline Tools
      • Census
        • Census Metadata Extracted
      • Stitch
        • Stitch Metadata Extracted
      • Airflow
        • Airflow Metadata Extracted
      • Dagster
        • Dagster Metadata Extracted
      • Fivetran
        • Fivetran Metadata Extracted
      • Glue
        • Glue Metadata Extracted
      • Hightouch
        • Hightouch Metadata Extracted
      • Apache Kafka
        • Apache Kafka Metadata Extracted
      • Confluent Cloud
        • Confluent Cloud Metadata Extracted
      • Polytomic
        • Polytomic Metadata Extracted
      • Matillion
        • Matillion Metadata Extracted
      • Airbyte
        • Airbyte Extracted Metadata
      • Informatica
        • Informatica Metadata Extracted
      • Azure Data Factory
        • Azure Data Factory Metadata Extracted
    • Data Transformation Tools
      • dbt
        • dbt Cloud
          • dbt Cloud Metadata Extracted
        • dbt Core
          • dbt Core Metadata Extracted
      • Coalesce
        • Coalesce Metadata Extracted
    • Data Quality Tools
      • Cyera
      • Dataplex
        • Dataplex Metadata Extracted
      • Great Expectations
        • Great Expectations Metadata Extracted
      • Monte Carlo
        • Monte Carlo Metadata Extracted
      • Soda
        • Soda Metadata Extracted
    • Data Lakes
      • Google Cloud Storage
        • GCS Metadata Extracted
      • AWS S3
        • S3 Metadata Extracted
    • Query Engines
      • Trino
        • Trino Metadata Extracted
    • Custom Integrations
      • File Upload
        • CSV File Format
        • JSONL File Format
        • Maintain your Resources
      • Marketplace
        • Secoda SDK
        • Upload and Connect your Marketplace Integration
        • Publish the Integration
        • Example Integrations
      • Secoda Fields Explained
    • Security
      • Connecting via Reverse SSH Tunnel
      • Connecting via SSH Tunnel
      • Connecting via VPC Peering
      • Connecting via AWS Cross Account Role
      • Connecting via AWS PrivateLink
        • Snowflake via AWS PrivateLink
        • AWS Service via AWS PrivateLink
      • Recommendations to Improve SSH Tunnel Concurrency on SSH Bastion
    • Push Metadata to Source
  • Extensions
    • Chrome
    • Confluence
      • Confluence Metadata Extracted
      • Confluence best practices
    • Git
    • GitHub
    • Jira
      • Jira Metadata Extracted
    • Linear
    • Microsoft Teams
    • PagerDuty
    • Slack
      • Slack user guide
  • Features
    • Access Requests
    • Activity Log
    • Analytics
    • Announcements
    • Audit Log
    • Automations
      • Automations Use Cases
    • Archive
    • Bookmarks
    • Catalog
    • Collections
    • Column Profiling
    • Data Previews
    • Data Quality Score
    • Documents
      • Comments
      • Embeddings
    • Filters
    • Glossary
    • Homepage
    • Inbox
    • Lineage
      • Manual Lineage
    • Metrics
    • Monitors
      • Monitoring Use Cases
    • Notifications
    • Policies
    • Popularity
    • Publishing
    • Queries
      • Query Blocks
        • Chart Blocks
      • Extracted Queries
    • Questions
    • Search
    • Secoda AI
      • Secoda AI User Guide
      • Secoda AI Use Cases
      • Secoda AI Security FAQs
      • Prompts
    • Sharing
    • Views
  • Enterprise
    • SAML
      • Okta SAML
      • OneLogin SAML
      • Microsoft Azure AD SAML
      • Google SAML
      • SCIM
      • SAML Attributes
    • Self-Hosted
      • Additional Resources
        • Additional Environment Variables
          • PowerBI OAuth Application (on-premise)
          • Google OAuth Application (on-premise)
          • Github Application (on-premise)
          • OpenAI API Key Creation (on-premise)
          • AWS Bucket with Access Keys (on-premise)
        • TLS/SSL (Docker compose)
        • Automatic Updates (Docker compose)
        • Backups (Docker compose)
        • Outbound Connections
      • Self-Hosted Changelog
    • SIEM
      • Google Chronicle
  • API
    • Get Started
    • Authentication
    • Example Workflows
    • API Reference
      • Getting Started
      • Helpful Information
      • Audit Logs
      • Charts
      • Collections
      • Columns
      • Custom Properties
      • Dashboards
      • Databases
      • Documents
      • Events
      • Groups
      • Integrations
      • Lineage
      • Monitors
      • Resources
      • Schemas
      • Tables
      • Tags
      • Teams
      • Users
      • Questions
      • Queries
  • FAQ
  • Policies
    • Terms of Use
    • Secoda AI Terms
    • Master Subscription Agreement
    • Privacy Policy
    • Security Policy
    • Accessibility Statement
    • Data Processing Agreement
    • Subprocessors
    • Service Level Agreement
    • Bug Bounty Program
  • System Status
  • Changelog
Powered by GitBook
On this page
  • Introduction
  • Types of Monitors
  • Creating Monitors
  • Managing Monitors
  • Best Practices
  • Monitoring Permissions
  • Monitoring Notifications
  • Monitors as Code
  • Monitoring Integrations

Was this helpful?

  1. Features

Monitors

Create data monitors for visibility into the health of your data stack

Last updated 1 month ago

Was this helpful?

Introduction

Monitoring plays a crucial role in maintaining data quality by allowing you to configure alerts for changes in your data. Automatically schedule monitors and set thresholds to track run history and visualize monitor performance.

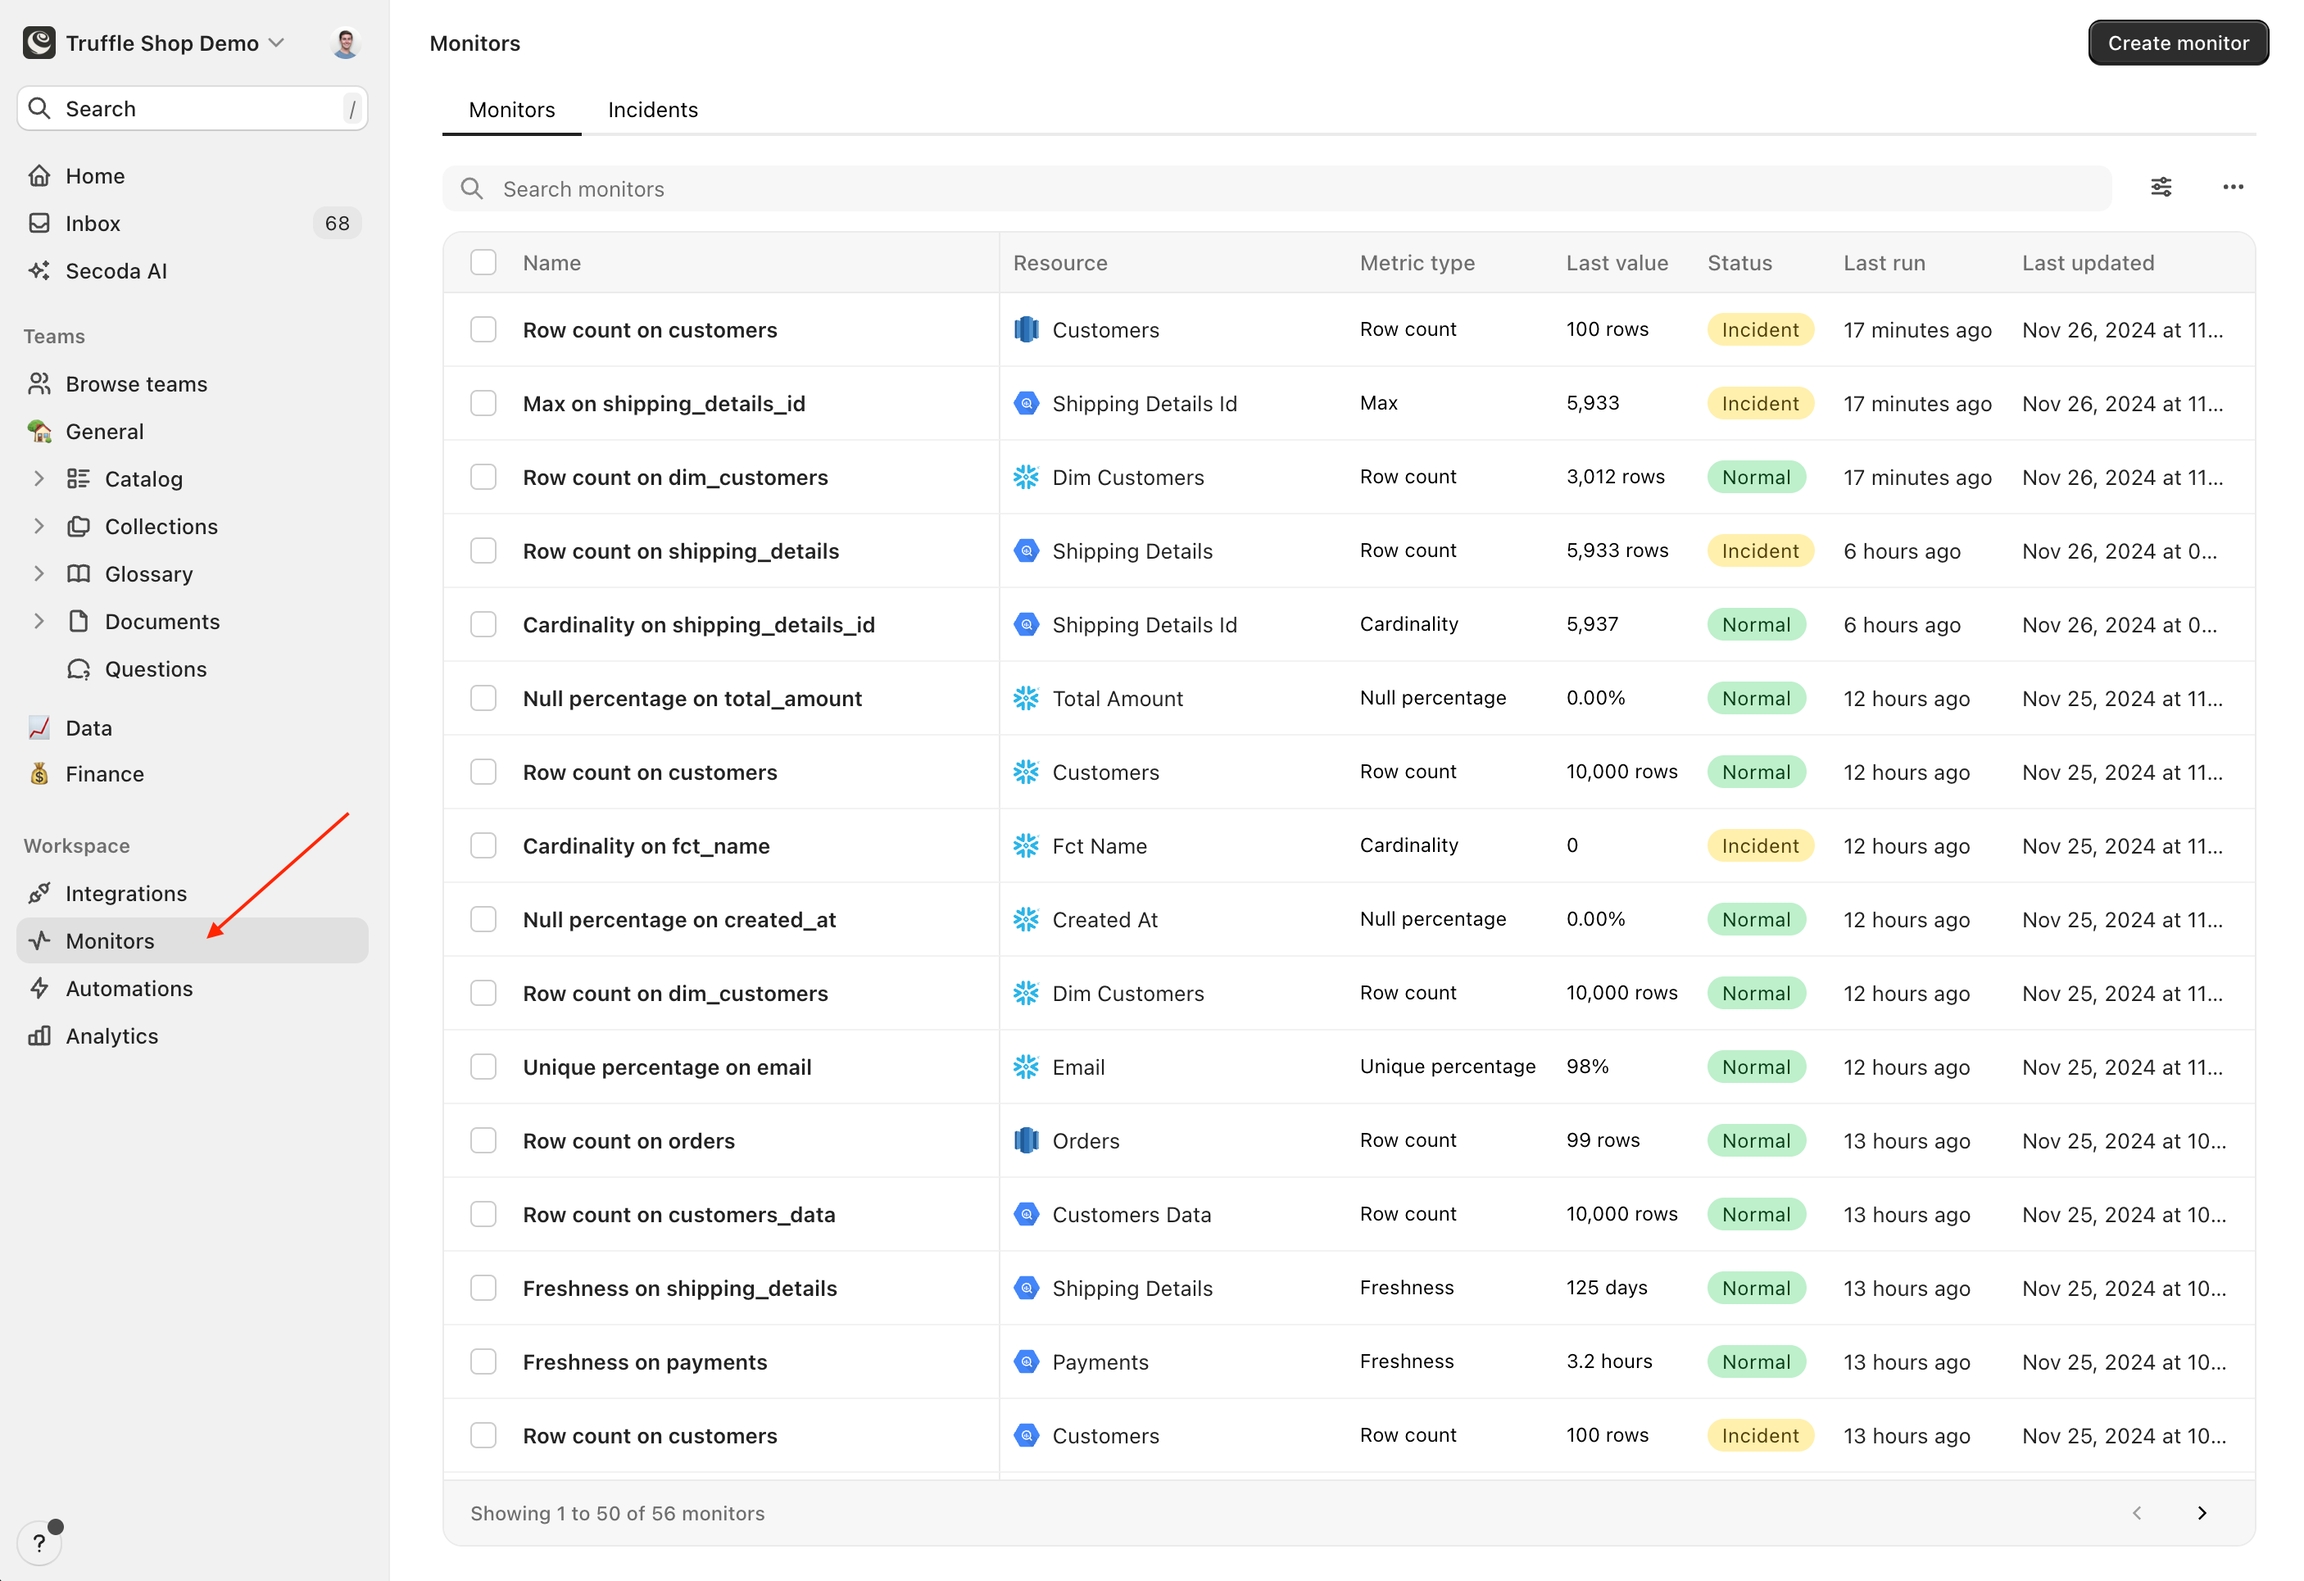
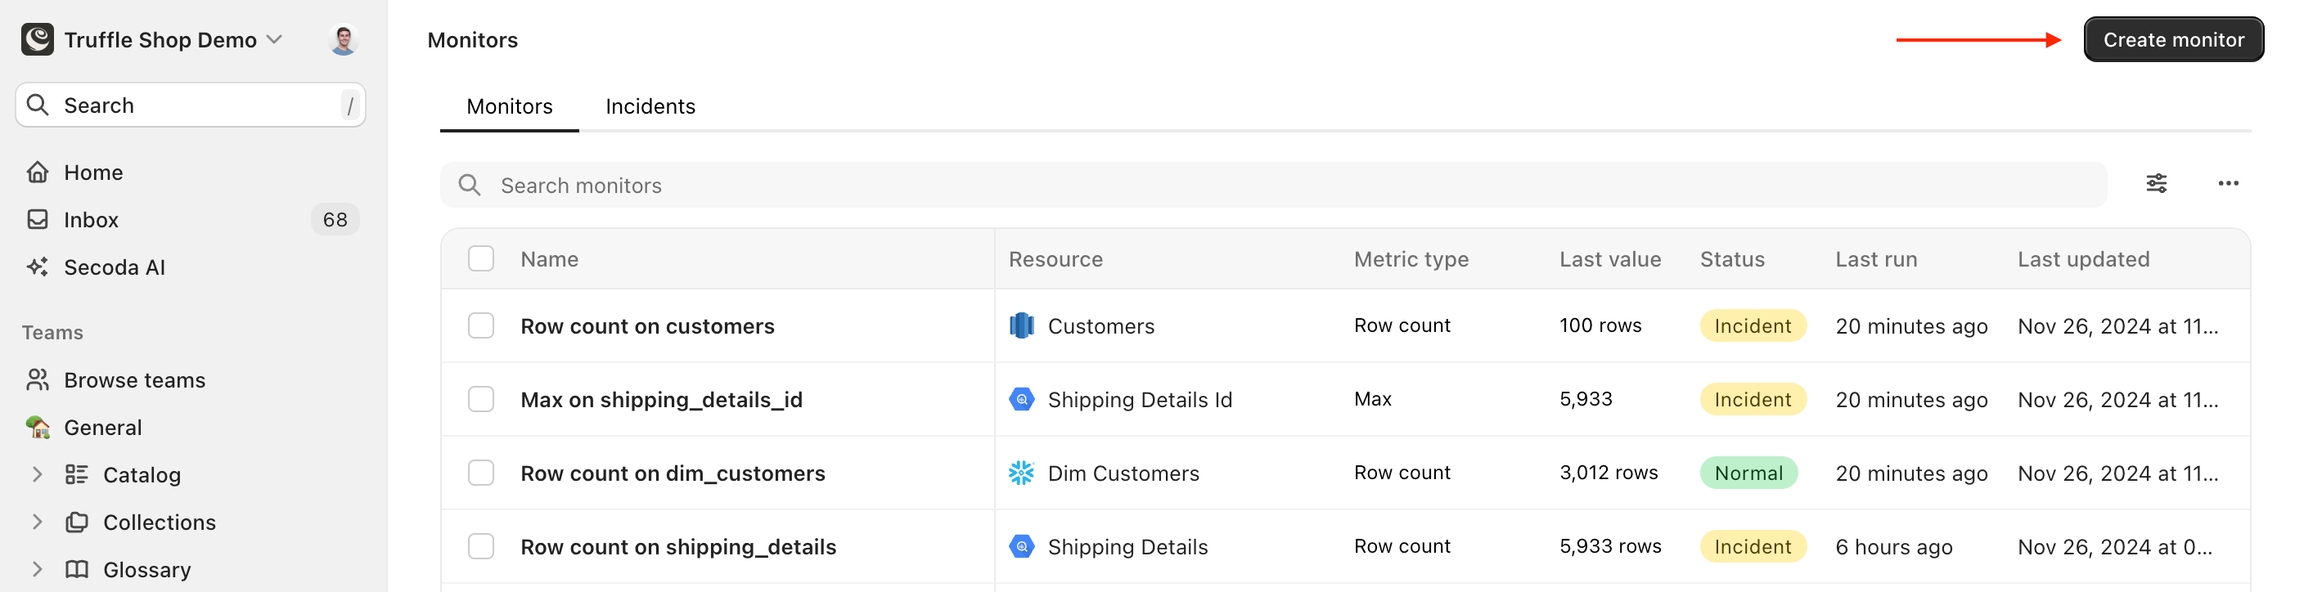
Admins and Editors can access existing Monitors from the Monitors page accessible via the side panel. Here, you can view all monitors and incidents across the platform and create new ones.

To learn about how our current customers are using Monitors in Secoda to improve their data quality, check out this list of Monitoring Use Cases.

Note: Read permissions for the source data (in addition to the metadata) are required for the monitoring feature.

Types of Monitors

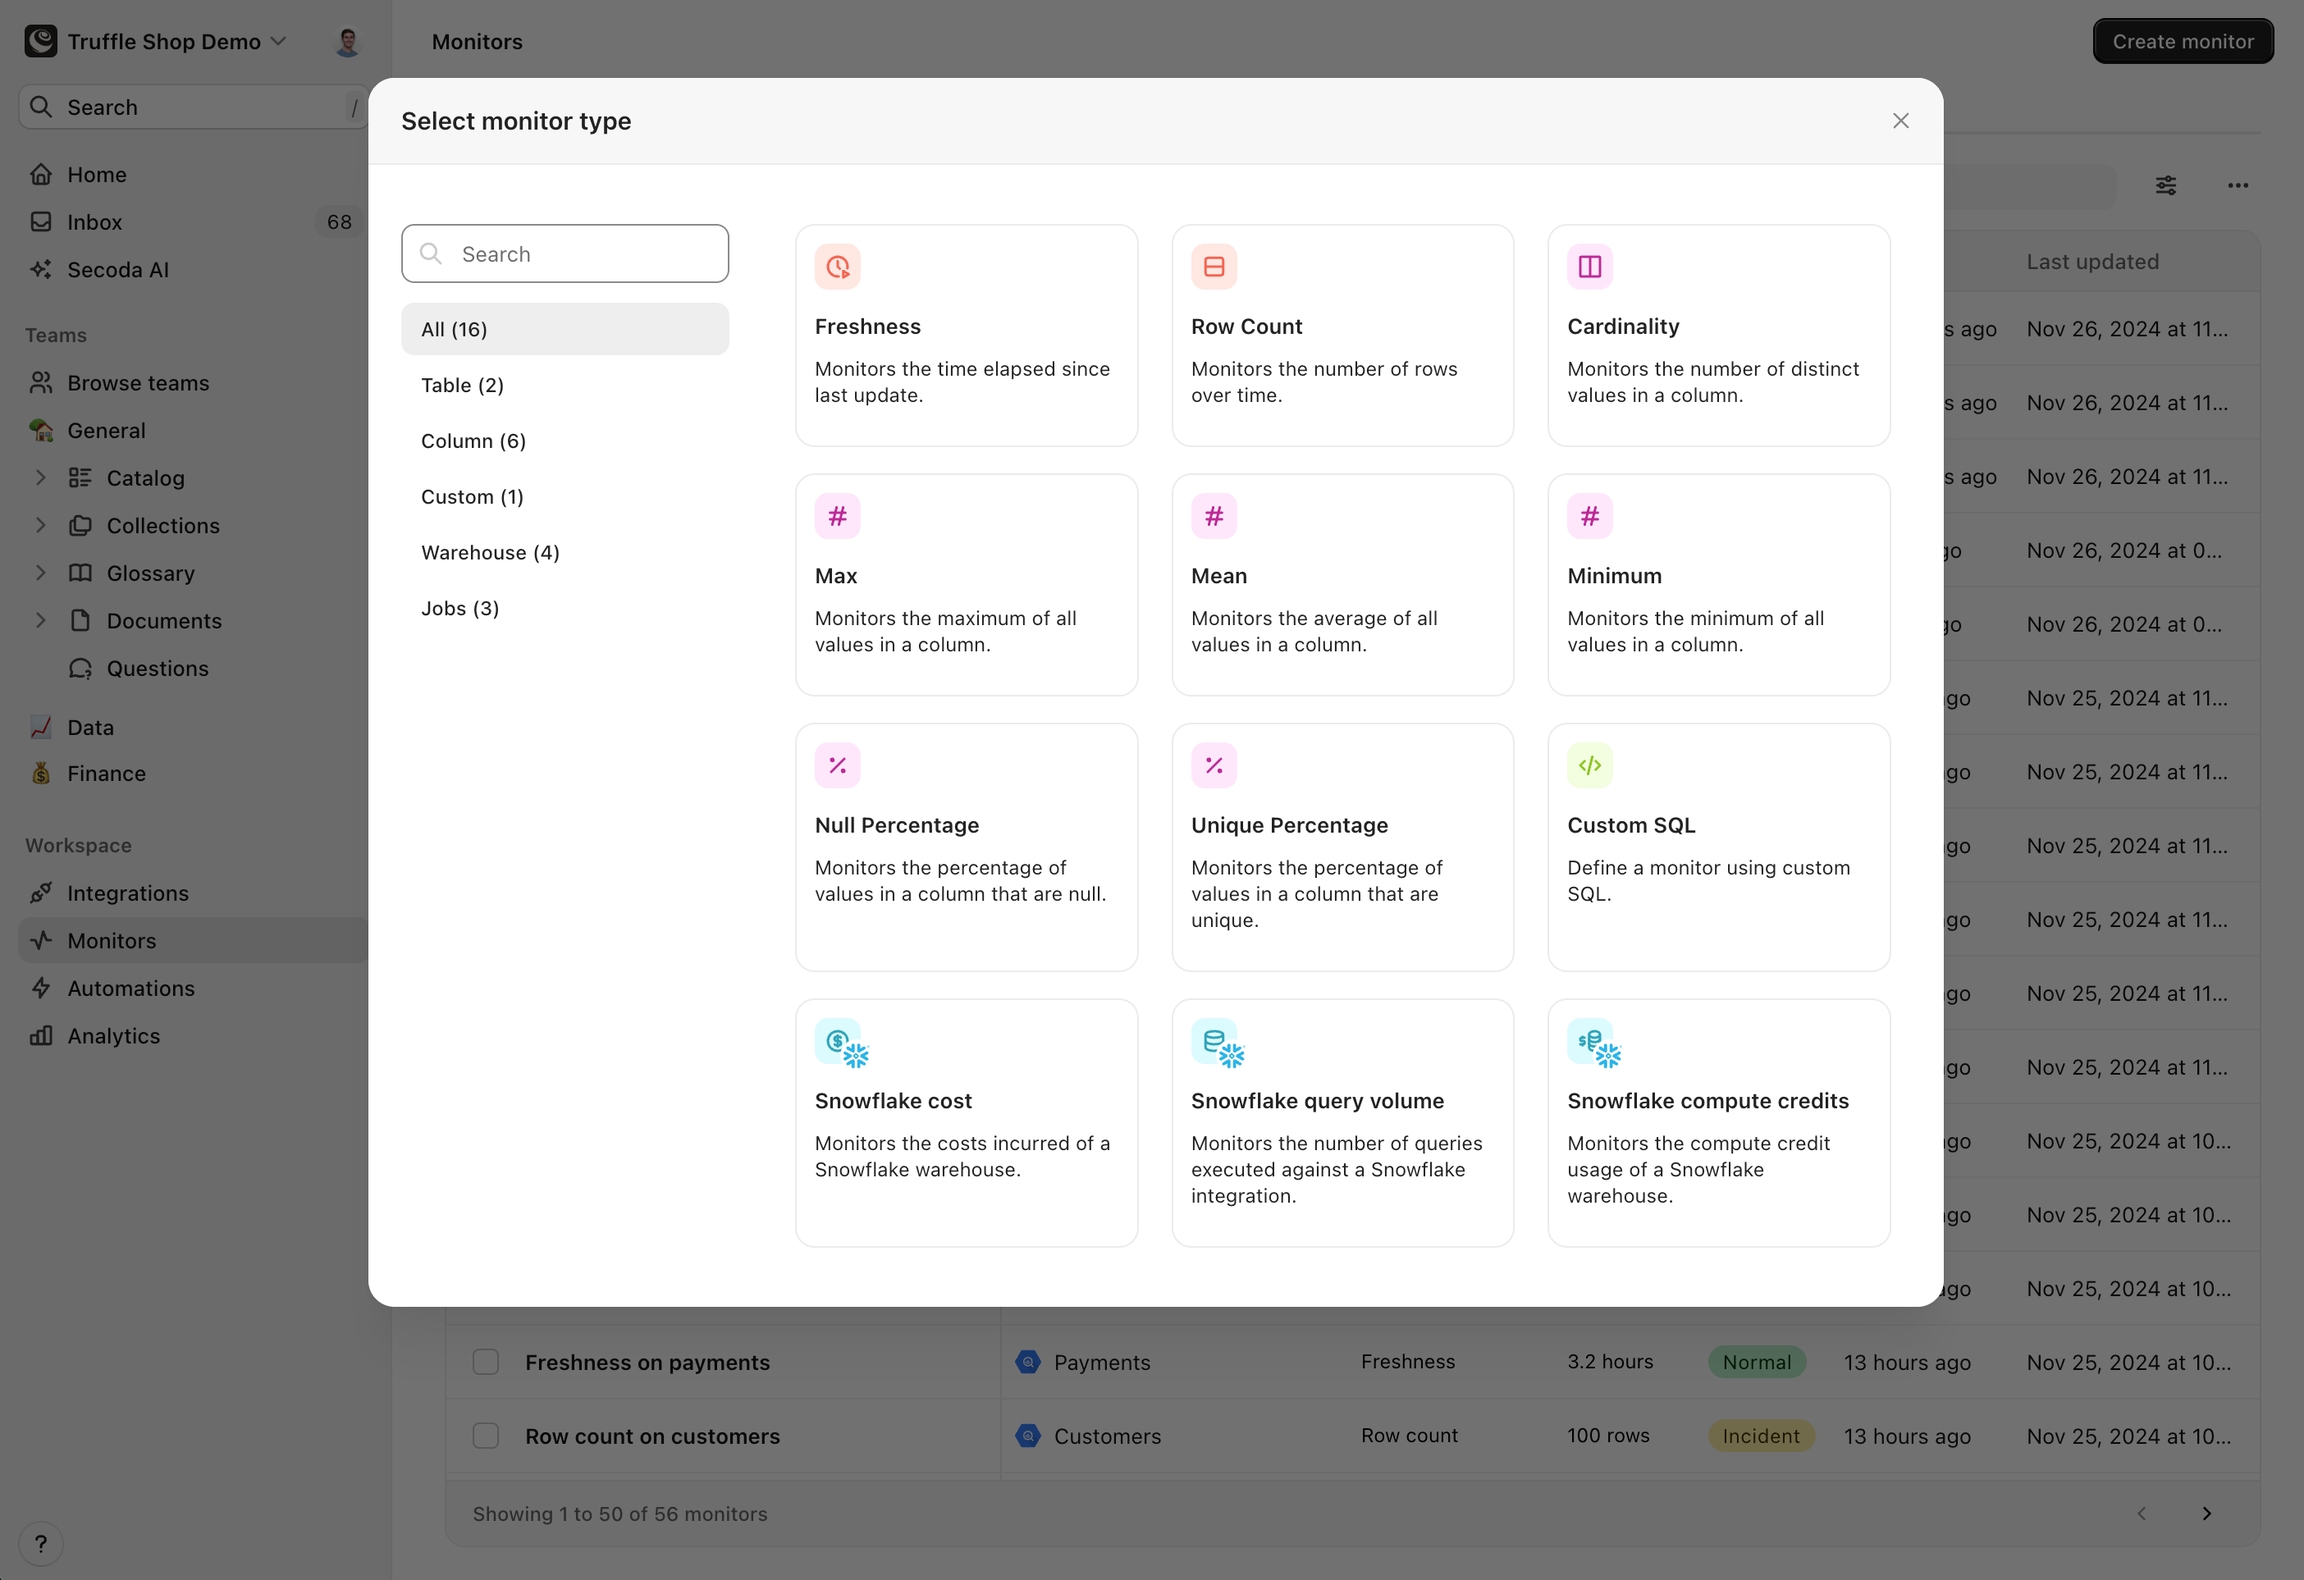
Select from a variety of Monitors to suit your needs:

Tables

  • Row Count - The number of rows over time

  • Freshness - The time elapsed since last update

Columns

  • Cardinality - The number of distinct values of a given column

  • Maximum - The highest value of a numeric column

  • Minimum - The lowest value of a numeric column

  • Mean - The arithmetic mean of a numeric column

  • Null Percentage - The percentage of values in a column that are null

  • Unique Percentage - The percentage of values in a column that are unique

Pipelines

  • Job duration - Average length of job runs

  • Job error rate - Percentage of failed job runs

  • Job success rate - Percentage of successful job runs

Snowflake

  • Cost - Daily total cost

  • Query Volume - Daily queries run

  • Compute Credits - Daily compute credits consumed

  • Storage Usage - Total storage usage

The monitor will alert if any of these values are higher or lower than expected.

Creating Monitors

Monitors can be created via the Monitors section in the sidebar or through the Monitors tab on the resource page:

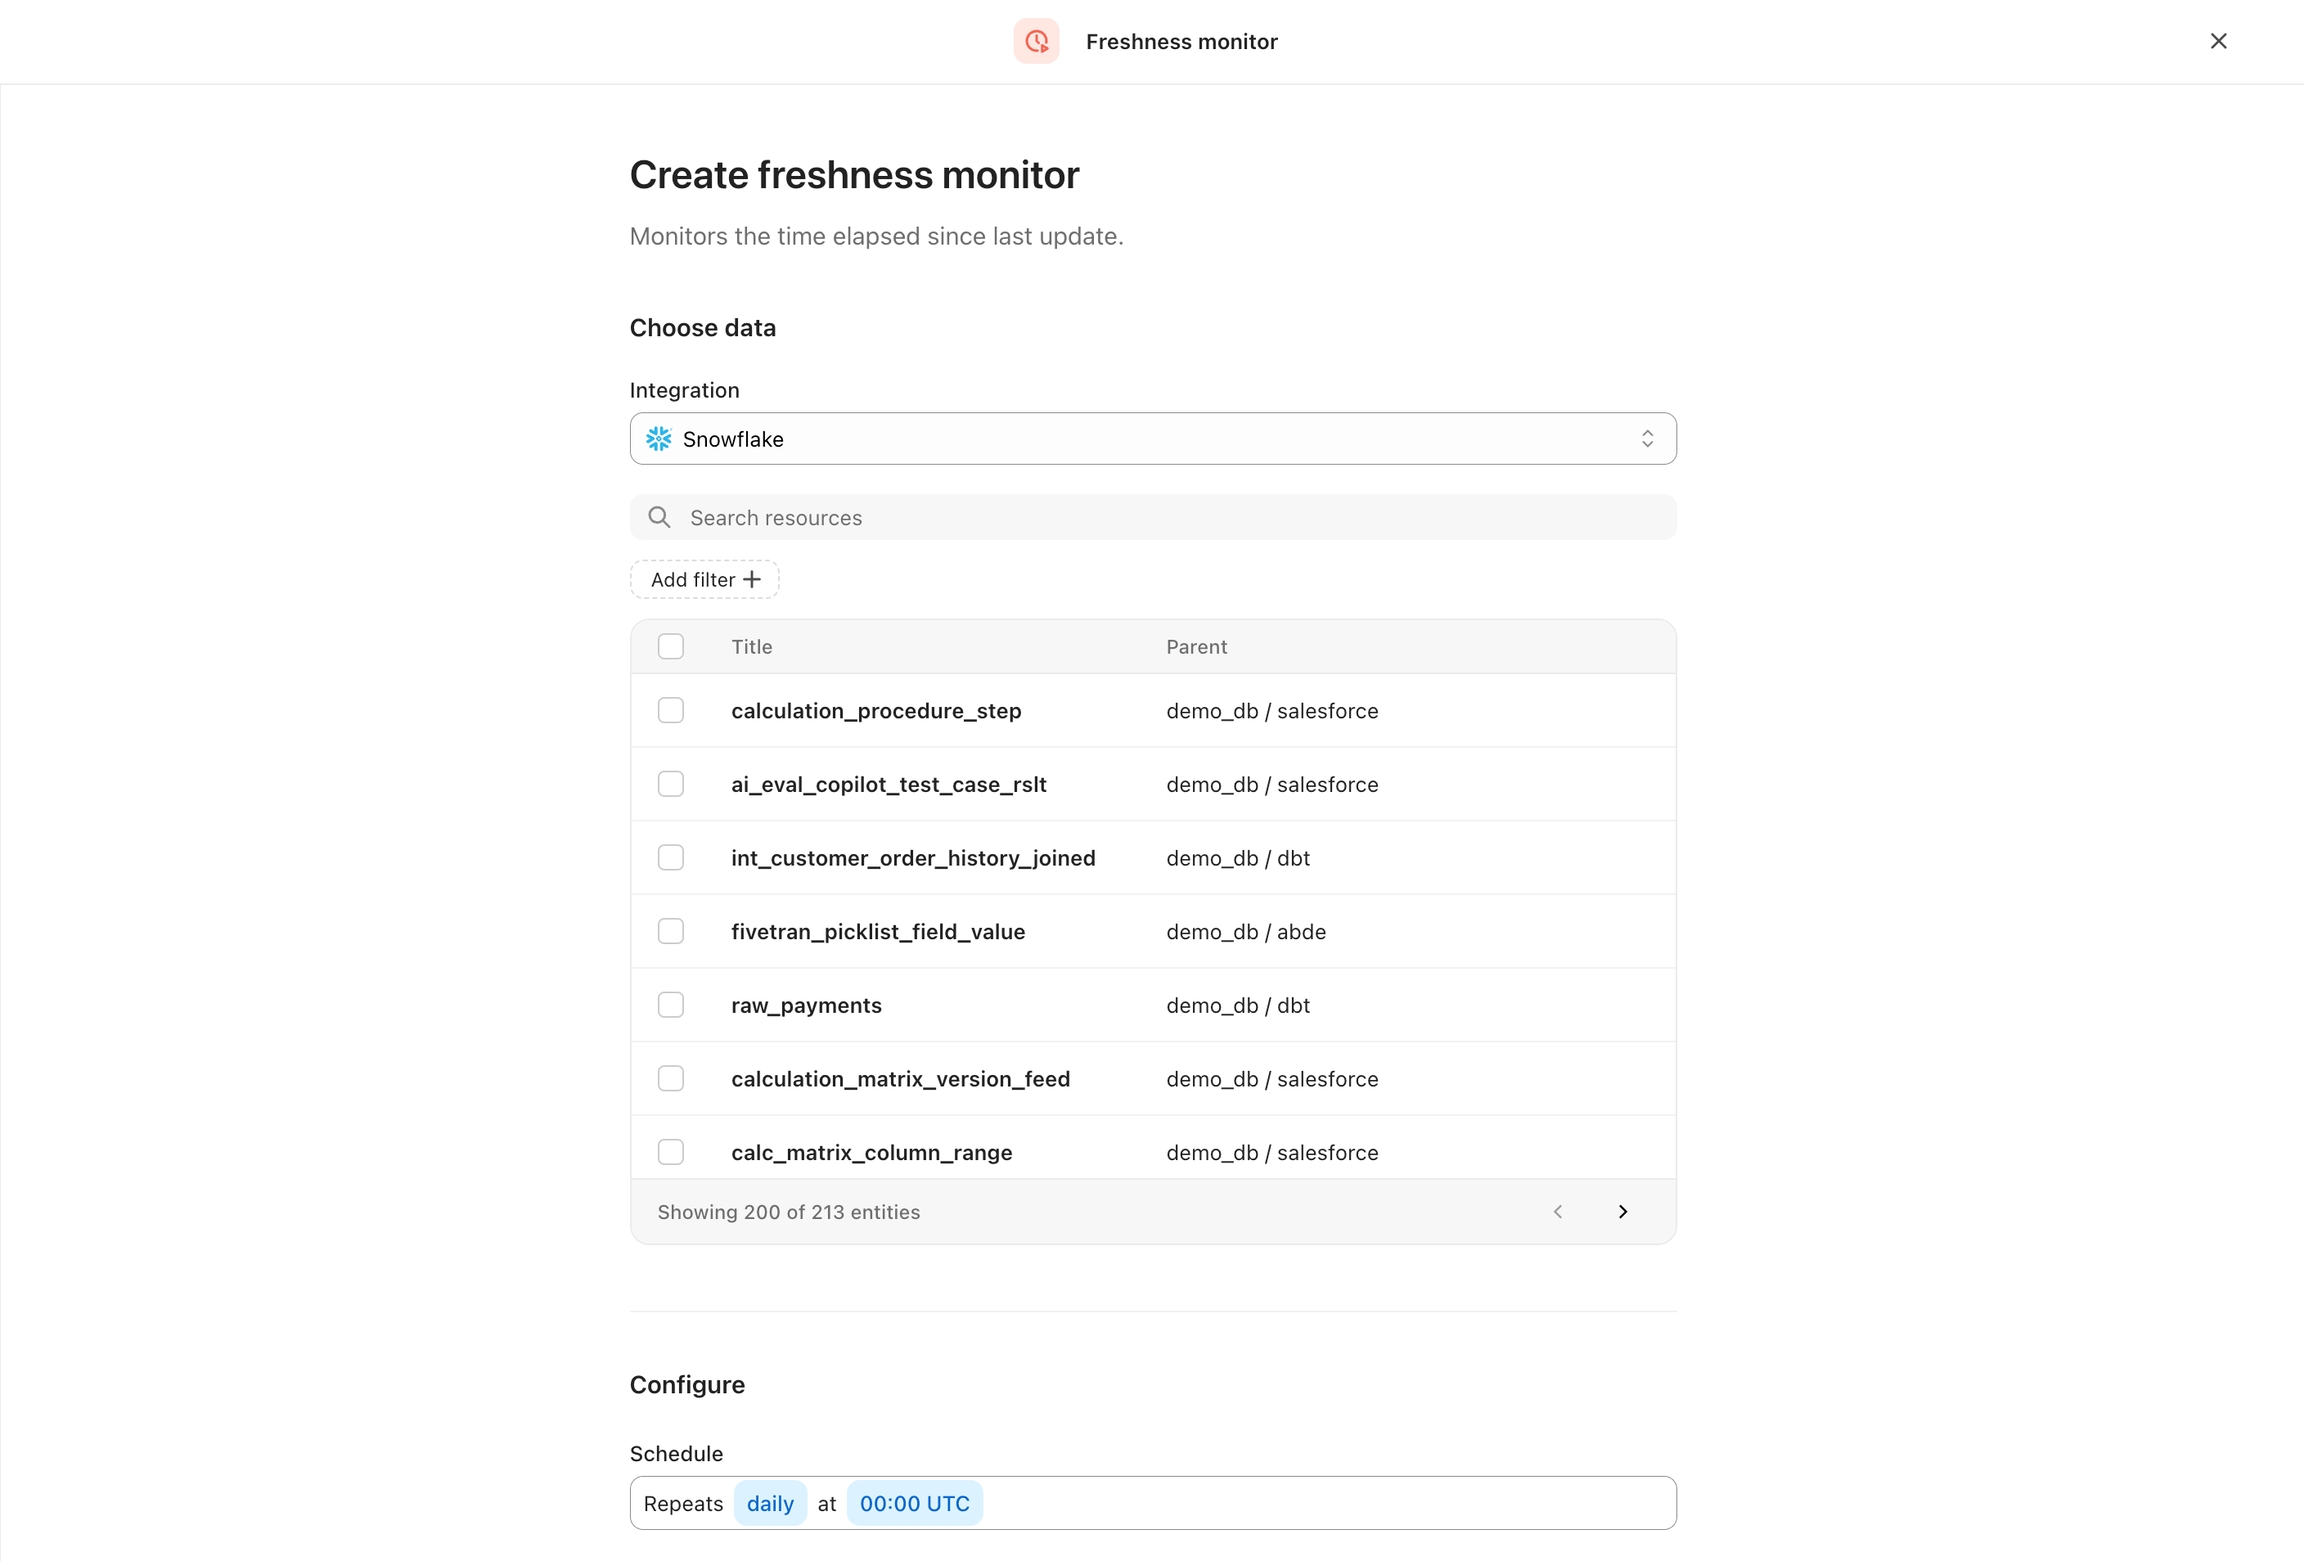
  1. Navigate to "Monitors" and click "Create monitor."

  1. Choose the monitor type and select the integration. If adding a new Monitor from the resource itself, the integration will be pre-selected.

  1. Select one or multiple resources that you'd like to add the monitor to.

  1. Adjust the Threshold and Schedule to your preferred configuration.

  • Schedule Options: Daily, Every 12, 6 or 3 hours, or Hourly

  • Threshold: Automatic or Manual

    • Note: For Automatic thresholds to be set, it can take 4 days for hourly, 6 days for multiple times a day, and 8-9 days for daily monitors.

  1. Once configured, click add monitor and it show now show up within the list of monitors. You can view and edit the configurations from the sidebar on the monitor page

Note: You can only add a monitor type which each of the columns support.

For example, if you have 3 numeric columns selected, you can add a "MIN" or "MAX" monitor, but you cannot do it if even one string column is selected in the modal.

Custom SQL Monitors

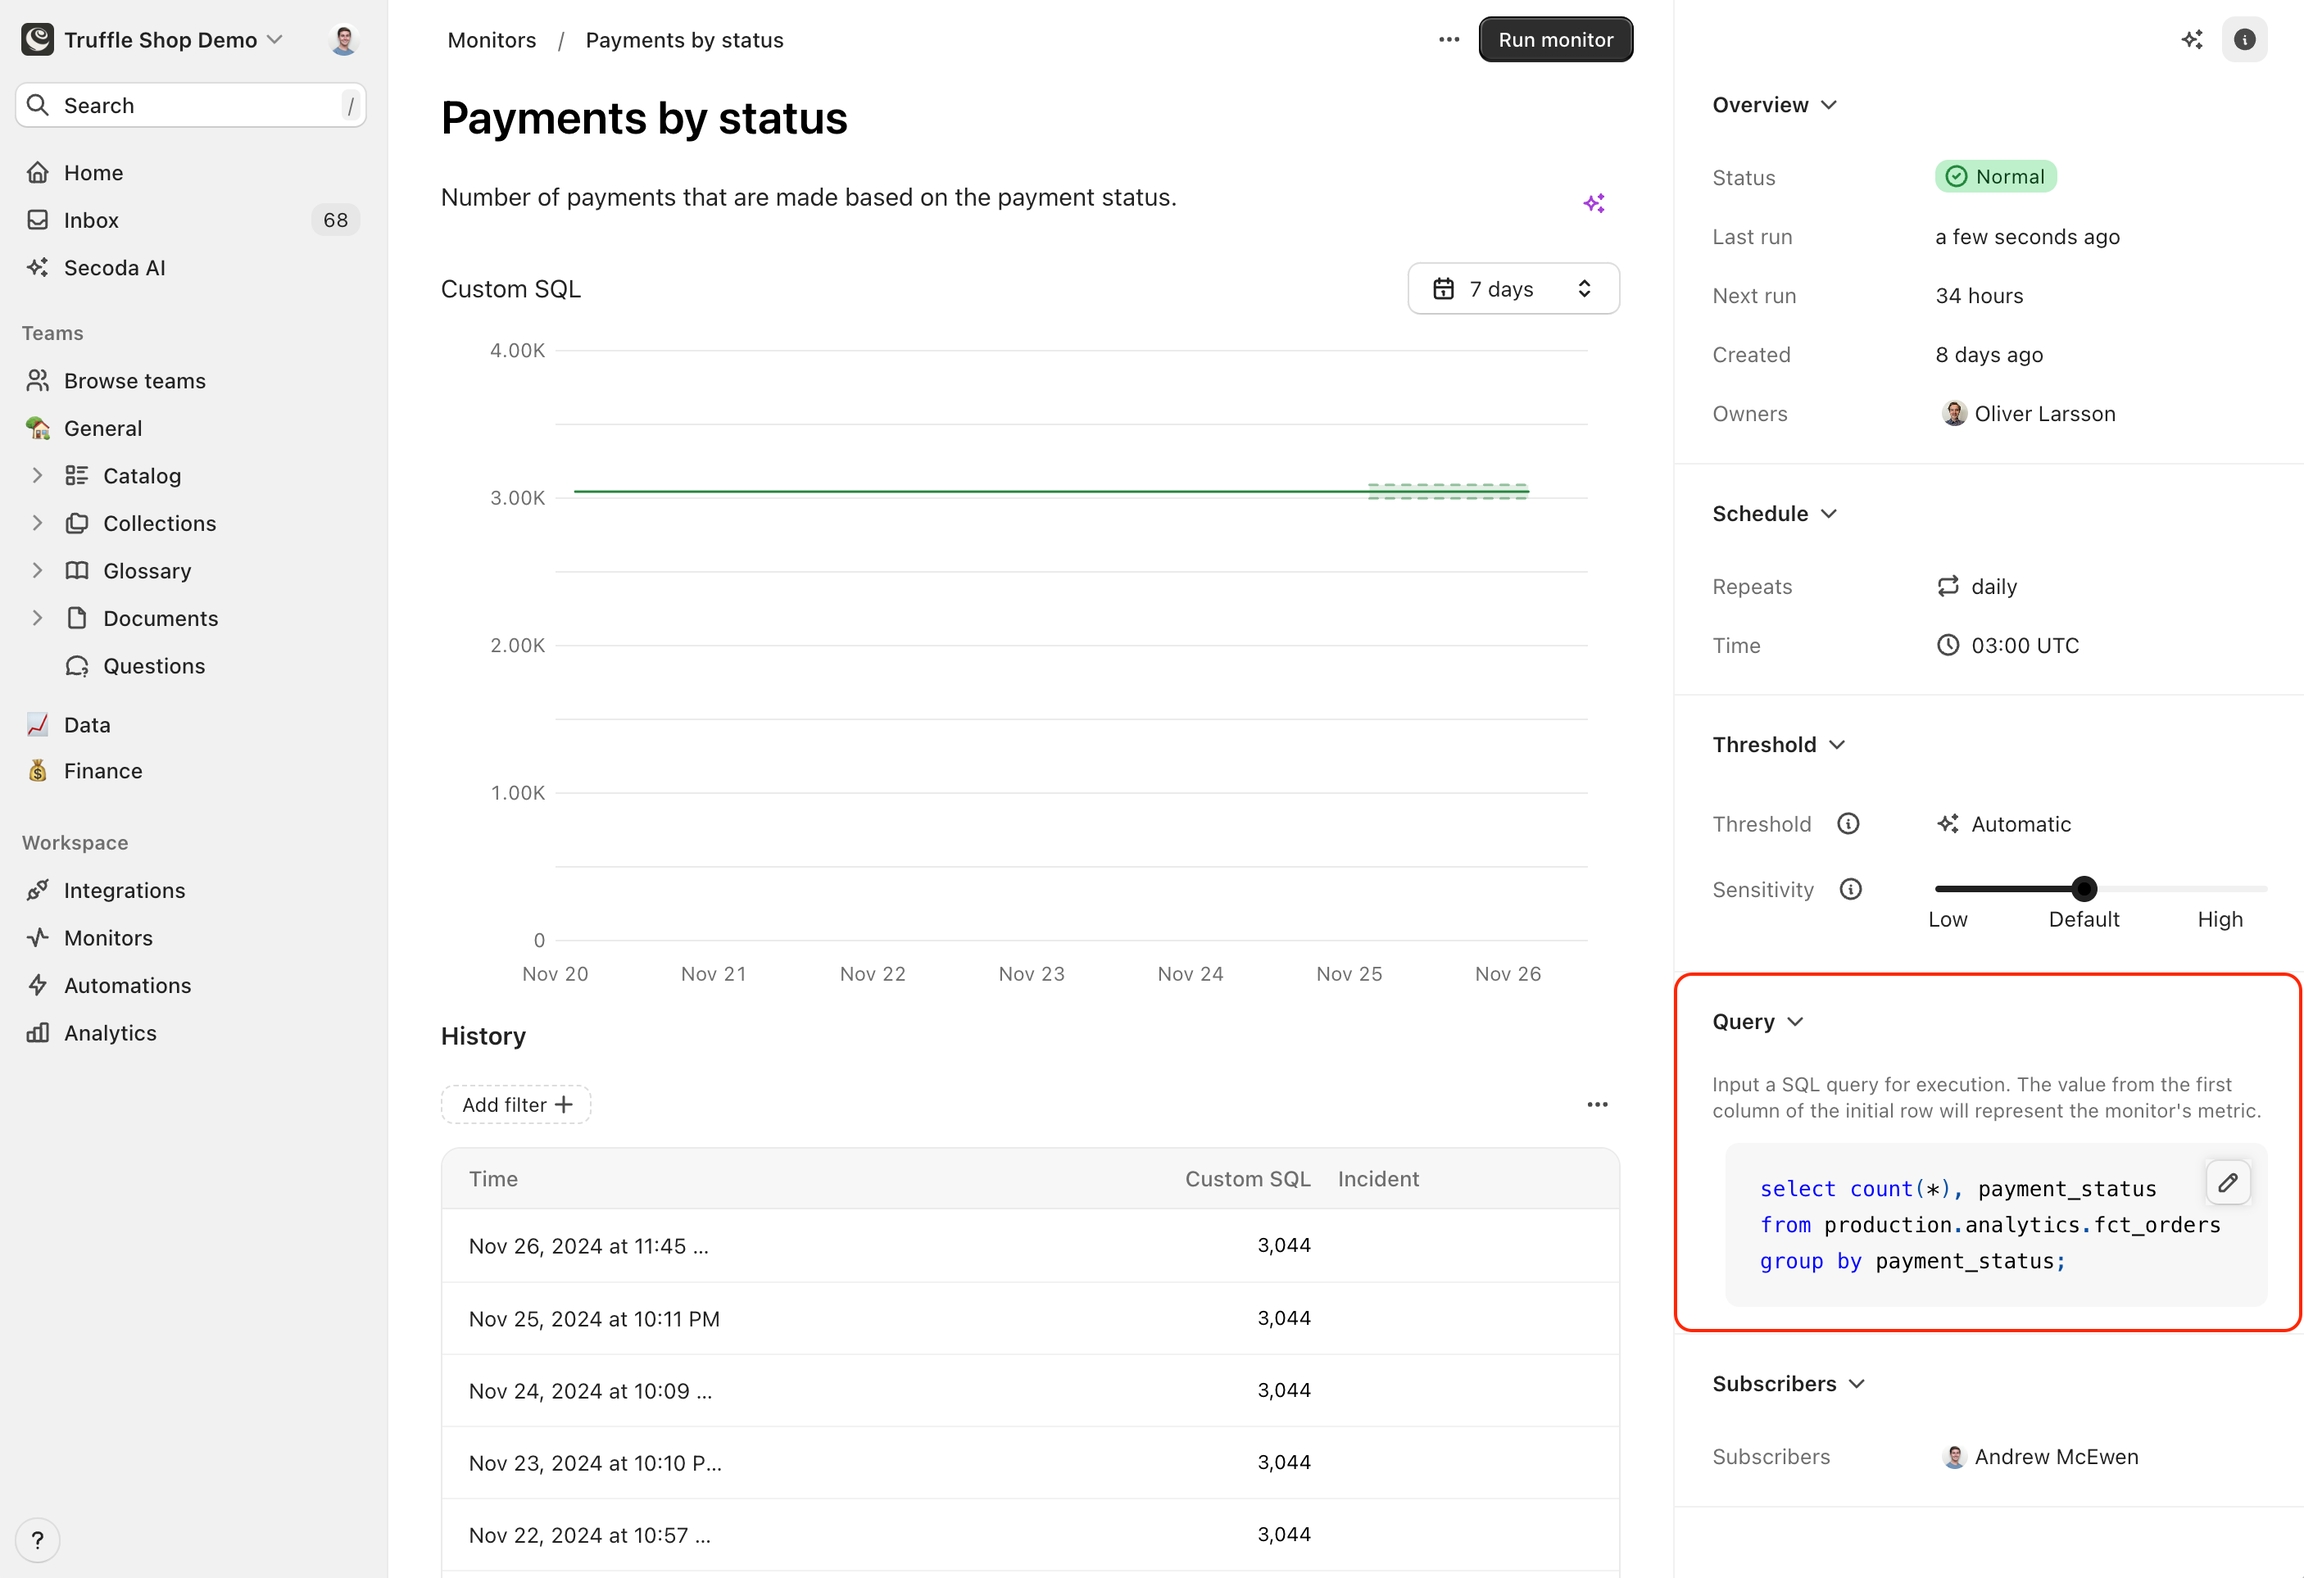
A user is be able to create a monitor that runs custom SQL to create an output. The only requirement is that the final output of the custom SQL must be a single value.

Follow the same steps as above, but choose "Custom SQL" as the Monitor type. After creating, click into it so that you can add your desired query in the right side panel.

WHERE clause

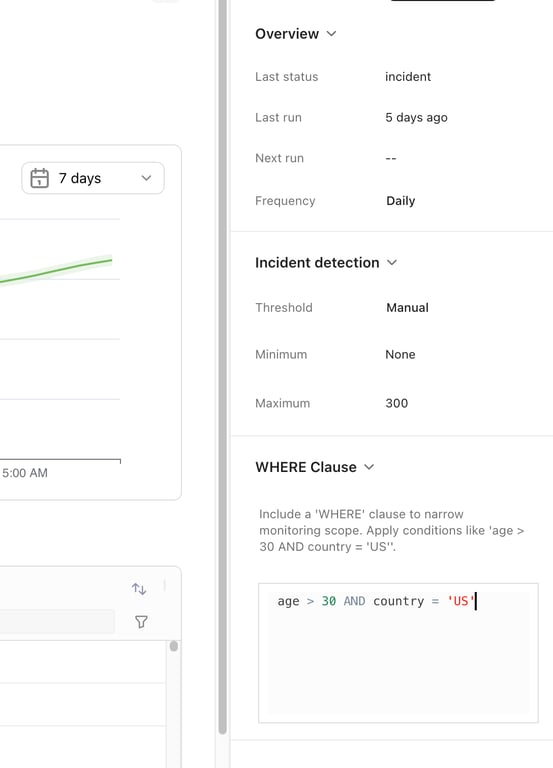
Standard monitors such as nullness, row count, etc can be modified with custom SQL that’s added as a WHERE clause within the standard SQL.

Managing Monitors

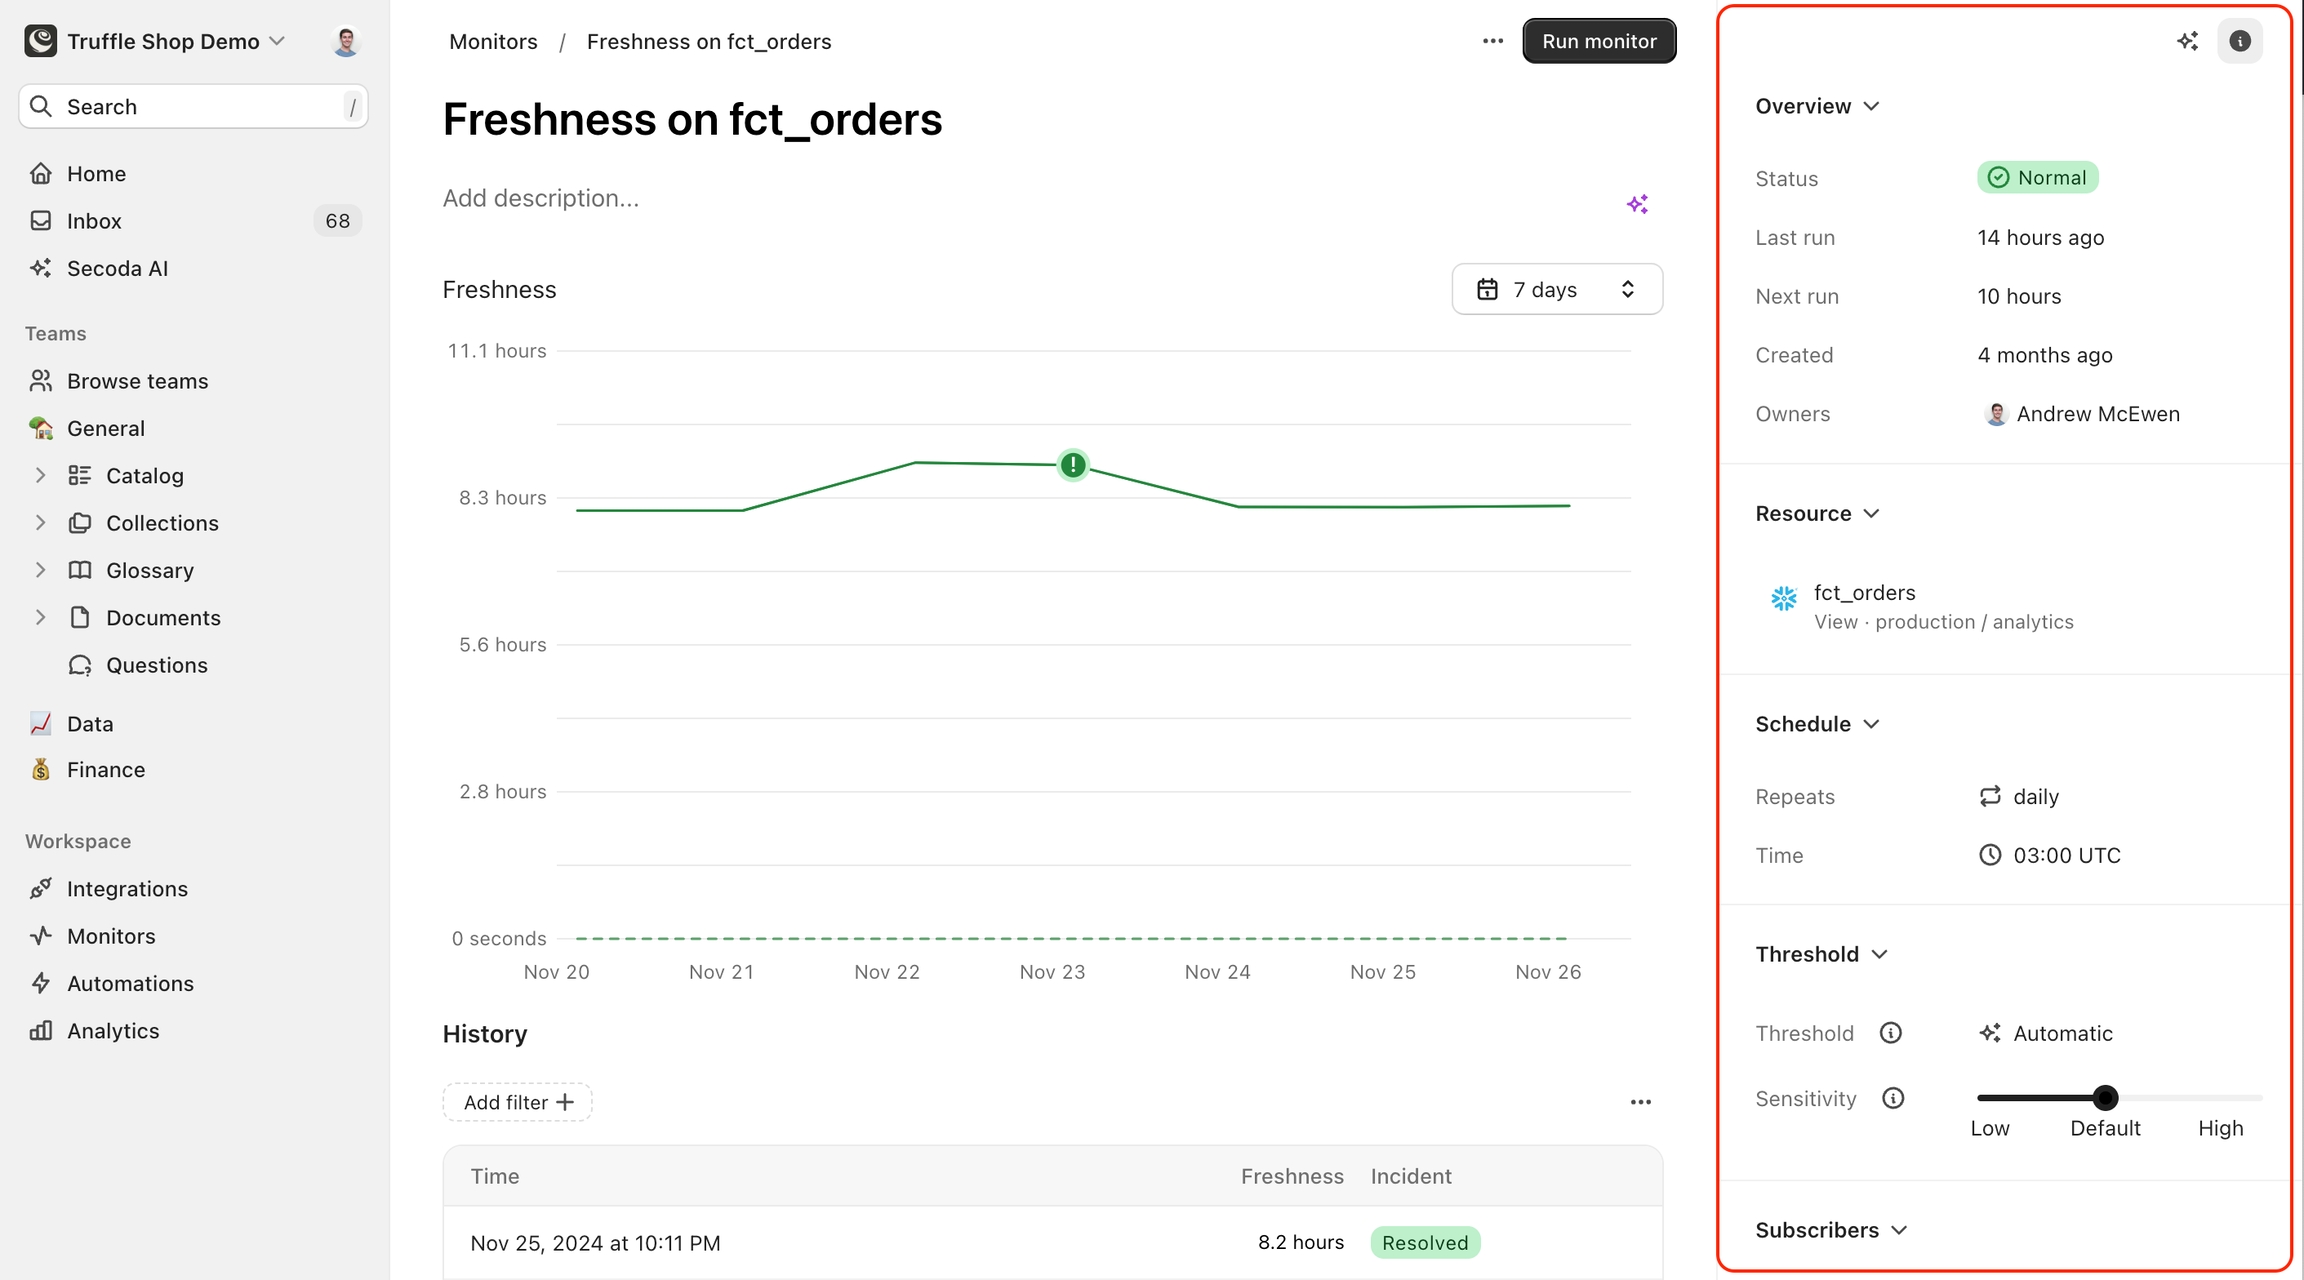
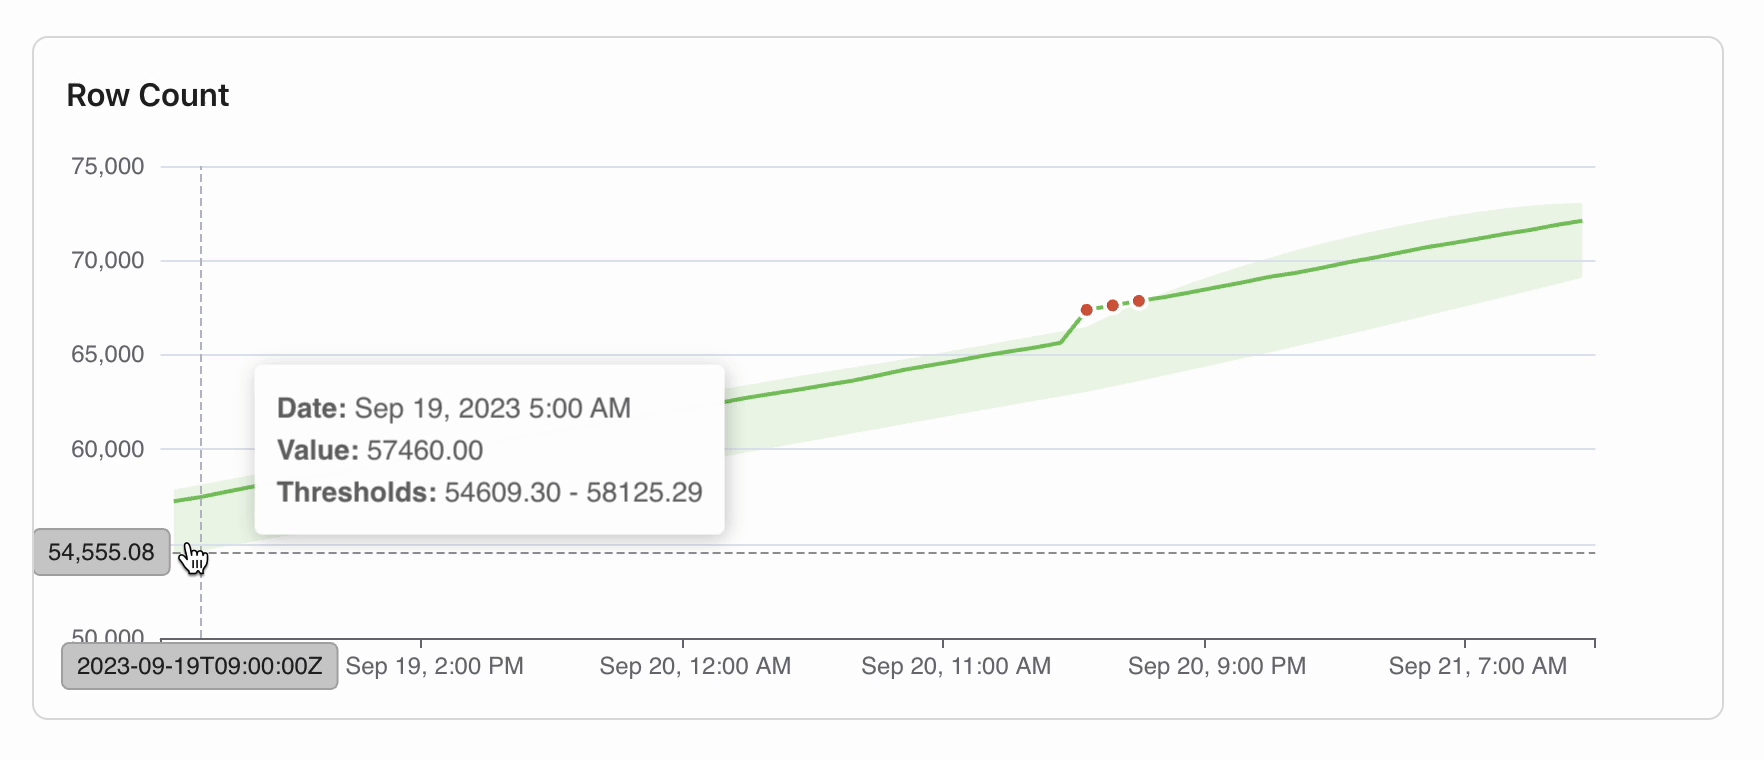
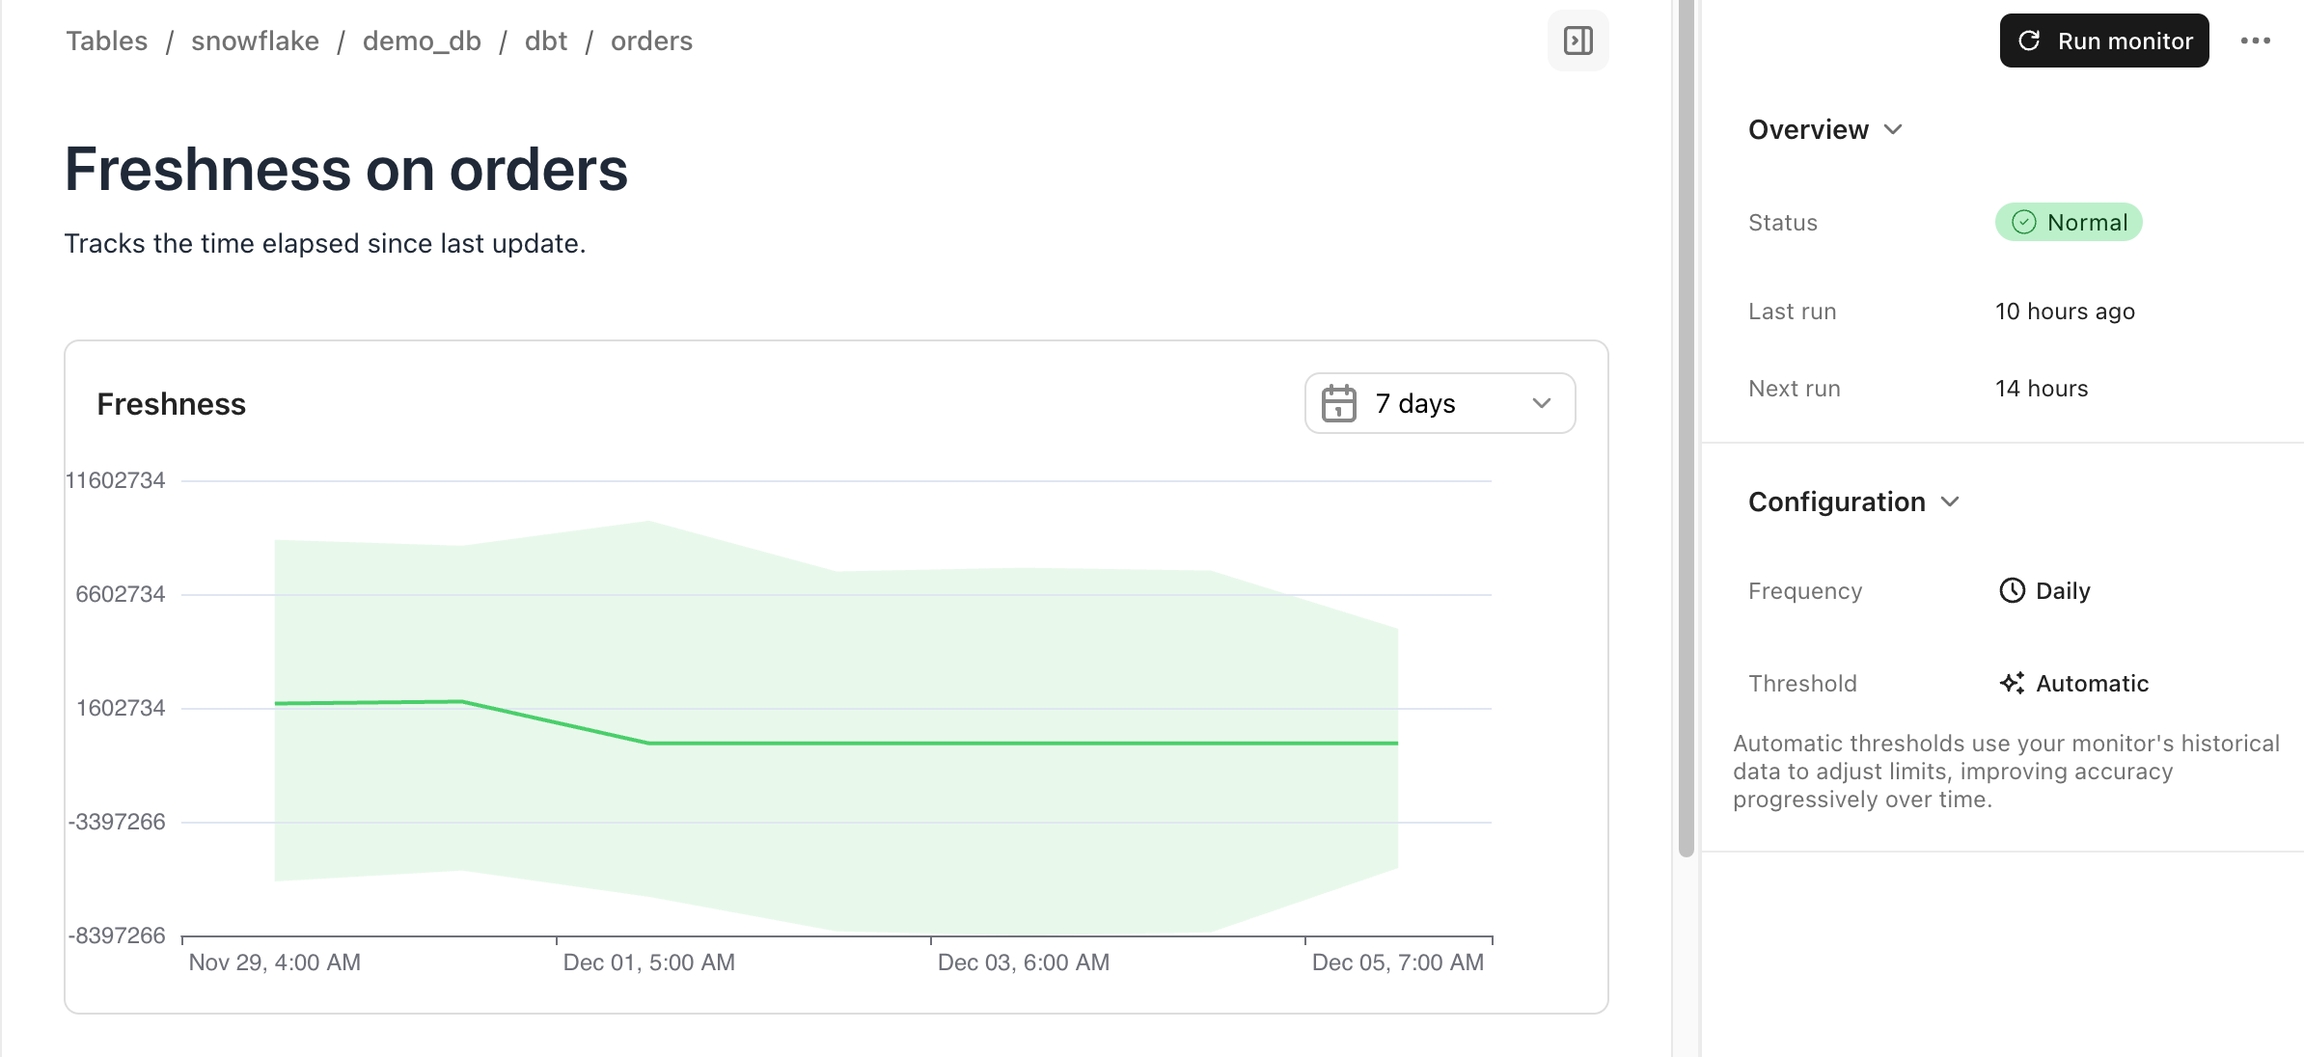
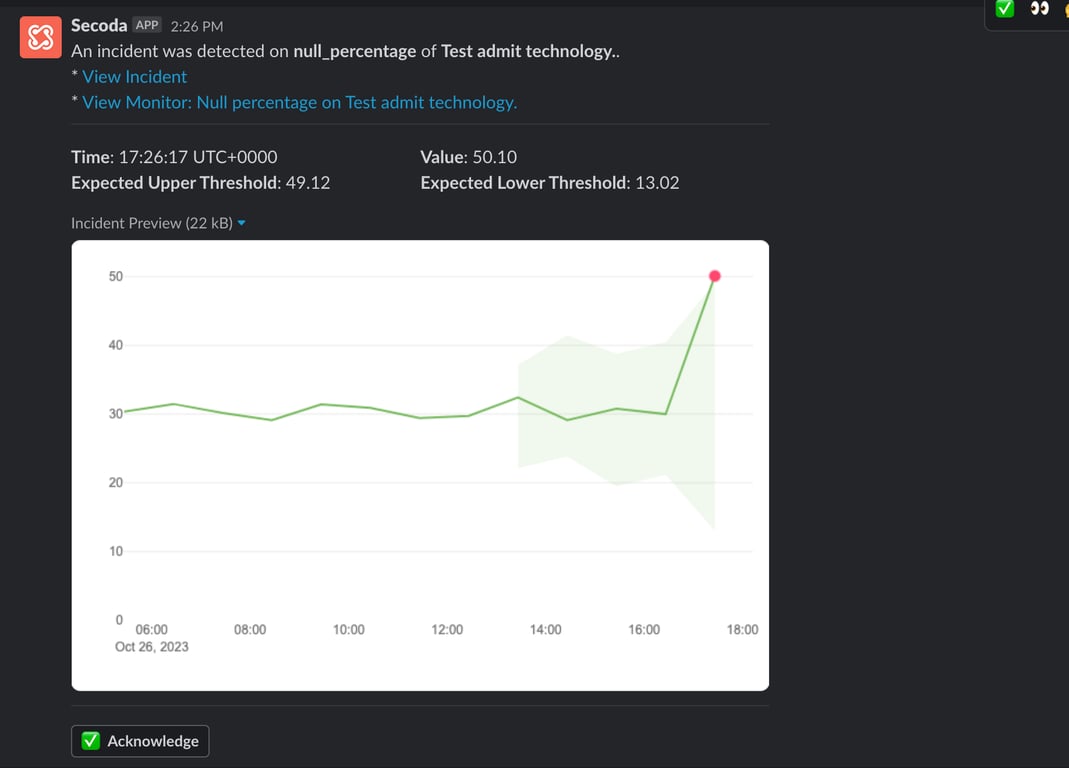
View Status, Last and Next Run details, and a Chart Visualization of the monitor's historical performance.

Thresholds and Incidents

If you've chosen Automatic thresholds, it can take up to a week for Secoda to finish learning what the right thresholds should be for your monitors.

The lighter green surrounding the main line represent the threshold limits - once the threshold is passed, it'll show a red dot indicating an incident

At the bottom of the Monitor page, you will find a history of all measurements, including those that have triggered incidents. You can easily filter this list to view only incidents and specify a particular time period.

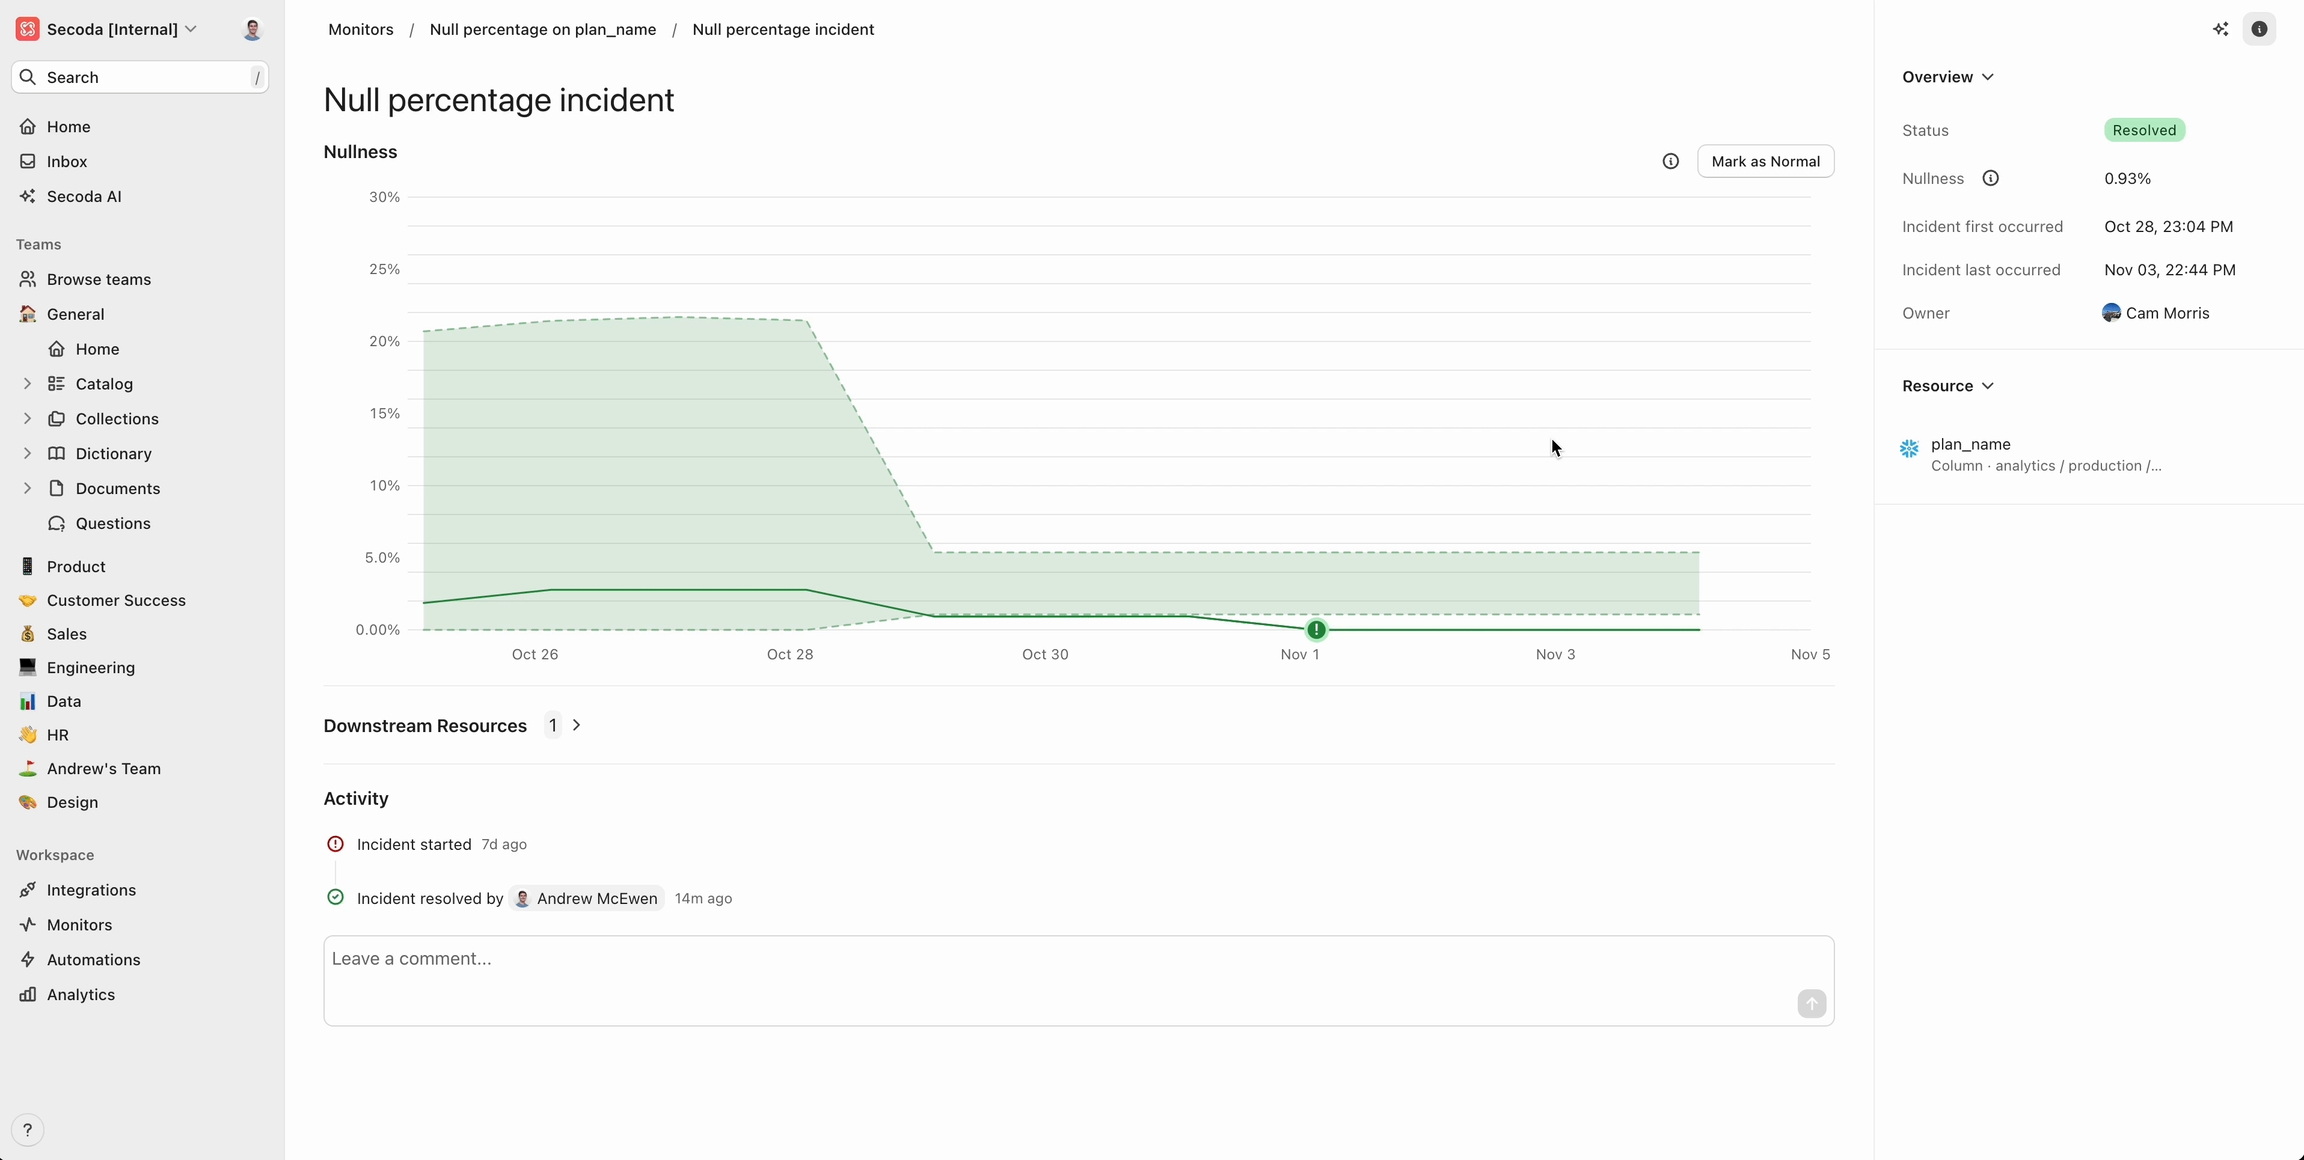
When an incident occurs, you have two primary options for handling it: you can either acknowledge the incident to recognize that it has occurred or resolve it once appropriate actions have been taken.

The incident page provides visibility into all resources impacted downstream of the affected table or column. Additionally, the activity log allows team members to comment on the incident, tag others, and add relevant context for resolution.

If you have an existing integration with Jira, you can create a ticket for the incident directly from the Secoda incident page, streamlining your workflow.

Incidents are automatically acknowledged if a comment is made or a Jira ticket is created. They are automatically resolved if the measurement returns to range after three consecutive monitoring runs.

This incident management system is designed to enhance team collaboration and streamline the resolution process.

Annotations

The Monitoring Annotations feature provides a way to mark specific data points within monitoring incidents, giving teams a deeper context and helping refine automatic thresholds over time. This feature includes a Normal button, which allows users to indicate that a particular data point is not an anomaly, but rather expected behavior.

Using Monitoring Annotations with the Normal Button

  1. Navigate to the Incident that you wish to annotate.

  2. Select the Normal button for the data point that you want to classify as expected.

  3. This action marks the data point as typical, contributing to the accuracy of Secoda's automatic thresholding over time.

By tagging data points through Monitoring Annotations, you help Secoda’s monitoring become more attuned to your data’s unique patterns, reducing false alerts and improving the identification of true anomalies.

Errors

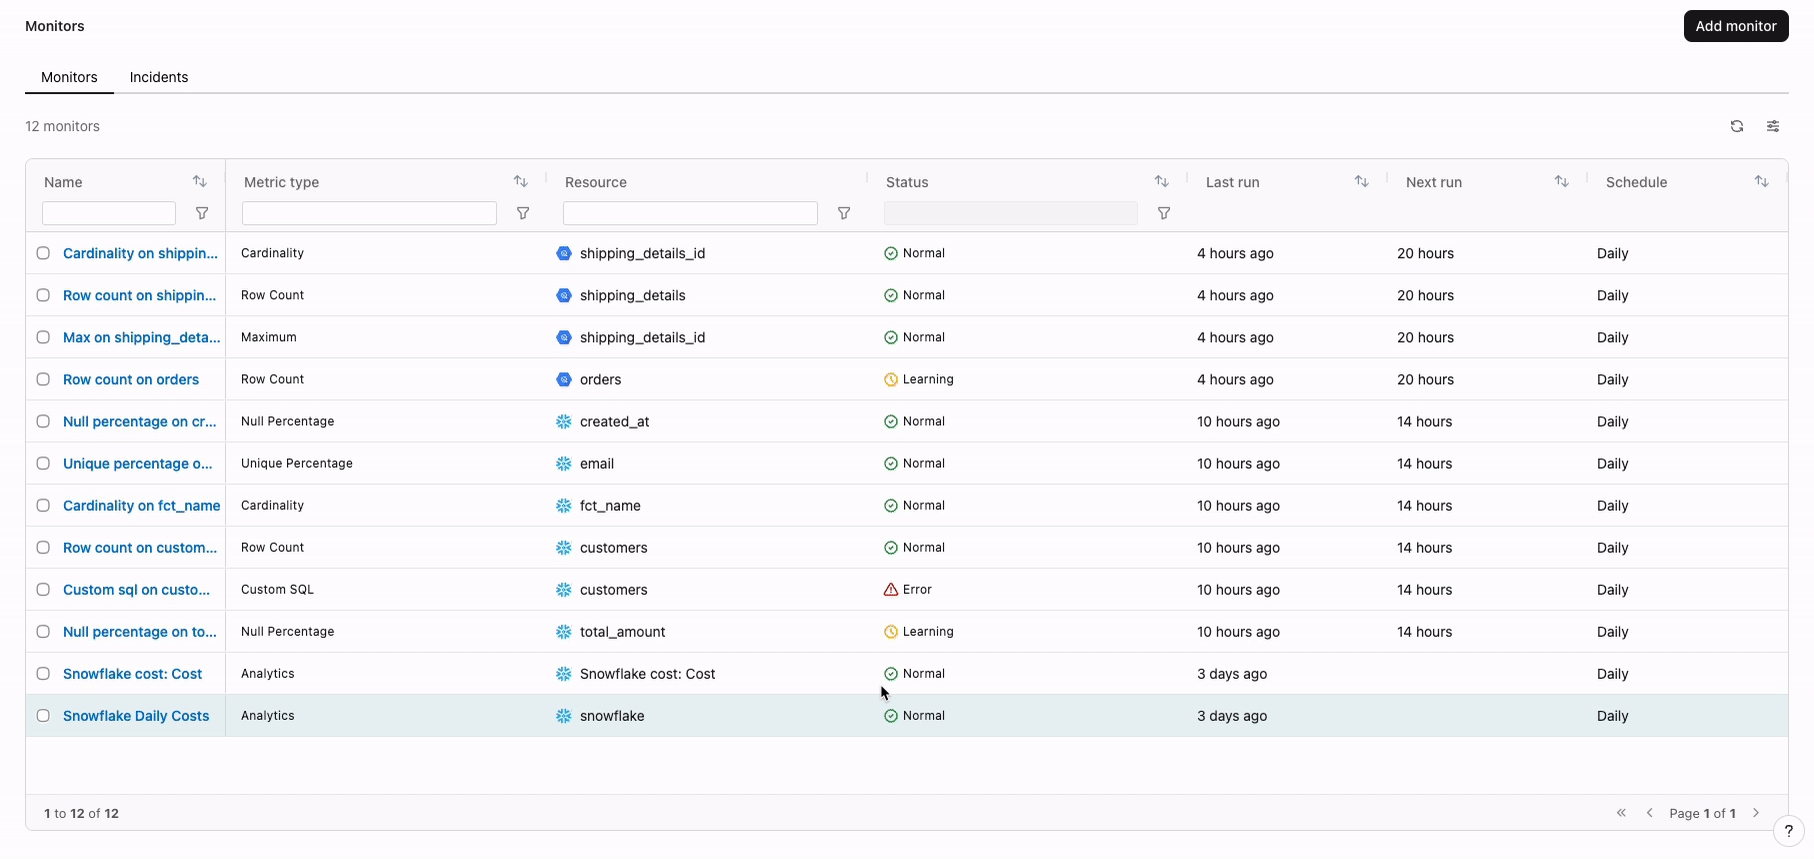
You may receive an error on your Monitors for various reasons. The Error will appear under Status. You are able to click into the error to see exactly what went wrong with the Monitor. In the example below, a Custom SQL monitor was chosen but a query was never provided, causing it to error out.

Best Practices

To optimize the effectiveness of data monitoring and manage resource utilization, consider these best practices:

  1. Selective Monitoring: Focus on the most critical data elements. Prioritize columns and tables that are essential for your business operations to avoid unnecessary strain on resources.

  2. Optimize Frequency: Set monitoring frequencies that balance timeliness and resource consumption. For many applications, configuring monitors to run daily is sufficient to catch issues without incurring excessive costs.

  3. Regular Reviews: Periodically review data quality monitoring configurations. This ensures that your monitoring strategies stay aligned with evolving business needs and data landscapes.

  4. Workflow Integration: Embed monitoring alerts into your team’s daily workflows using tools like Slack or email (see Monitoring Notifications). This ensures that the right personnel are promptly notified, enabling swift action.

  5. Documentation and Training: Keep detailed documentation of your monitor setups and procedures. Train your team on the importance of monitoring and the actions required when specific alerts are triggered.

  6. Trend Analysis: Leverage historical data from your monitoring activities to identify trends and patterns. This analysis can help refine your data management practices and predictive monitoring over time.

By following these guidelines, you can ensure your monitoring processes are both efficient and effective, providing critical insights while maintaining control over costs and resource use.

Monitoring Permissions

Monitoring functionality is primarily intended for users with Edit or Admin roles, rather than end business users who typically have Viewer permissions.

  1. Creating:

    • Any Admin or Editor can now create monitors, without requiring specific integration permissions.

  2. Editing and Owning:

    • Initially, any Admin or Editor can edit monitors. However, once an owner is designated for a monitor, only the owner and Admins will have editing rights.

    • Owners and Admins will also have the ability to invite additional owners to the monitors.

  3. Deleting, Running, and Resolving:

    • The permissions for deleting, running, and resolving monitors will mirror those for editing. This means that only the monitor's owner and Admins can perform these actions once an owner is assigned.

  4. Viewing:

    • Viewing permissions remain unchanged, with any Admin or Editor able to view monitors. We are planning future updates that will allow more granular control over who can view monitor outputs, enhancing privacy and data security.

Monitoring Notifications

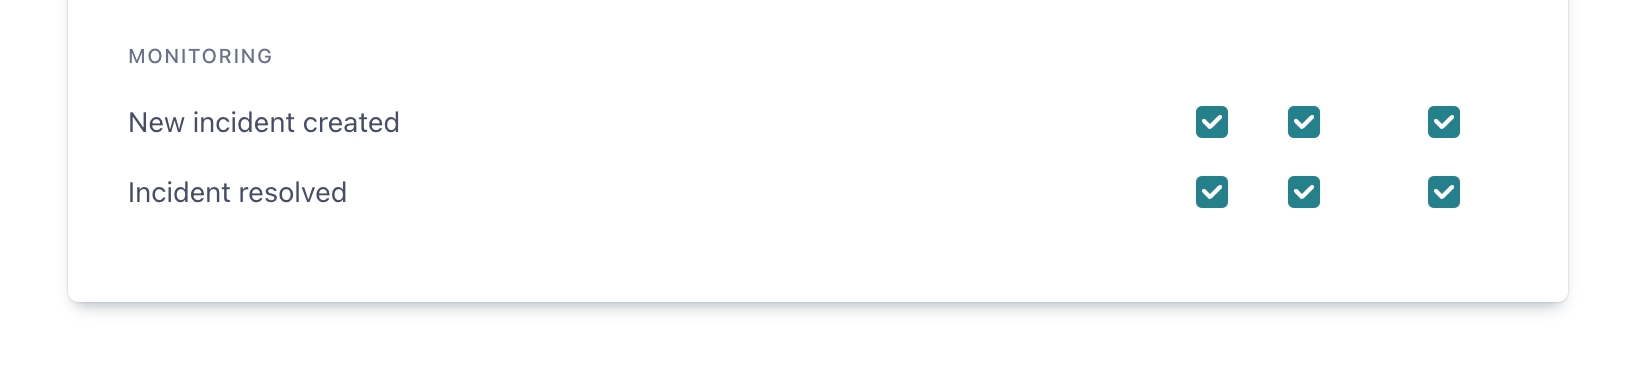
Stay informed about the status of your monitors by adjusting your Notification settings. Specify your preferred channels for receiving alerts—whether through Slack DMs, email, or directly within the app.

Notifications for monitor incidents are issued only after the first occurrence following a successful run. The same incident will not trigger new alerts unless the issue has been resolved and another incident occurs. This policy minimizes repetitive alerts and ensures that notifications remain meaningful and actionable.

Configuring Slack Channel Notifications

Email Monitoring Notifications

Email notifications provide direct links to the relevant sections in Secoda. As shown in the image below, clicking the "Open Secoda" link takes you to the Inbox notification, while other links direct you to specific incidents or tables.

Monitors as Code

You can declare Secoda monitors directly in your dbt model YAML files. These monitors are managed entirely through code and cannot be modified through the Secoda UI. Changes are applied when the dbt integration syncs with Secoda.

Monitor Configuration Formats

Monitors can be specified using two formats:

List Format (Default Configuration)

monitors:
  - mean
  - max
  - null_percentage

When using list format, each monitor uses these default settings:

  • Automatic thresholds (sensitivity: 5)

  • Daily schedule (runs once per day at UTC midnight)

  • Both upper and lower bounds

  • Auto-generated monitor name

Dictionary Format (Custom Configuration)

monitors:
  mean: {}  # Empty dict for default configuration (same defaults as list format)
  null_percentage:
    name: "Custom Null Check"
    thresholds:
      sensitivity: 8
      bounds: lower

You can mix both formats across different models and columns, but each individual monitors section must use either list or dictionary format, not both. Use list format for simplicity when default settings are sufficient, and dictionary format when you need to customize any monitor settings.

Available Monitor Types

Table-Level Monitors

  • row_count: Tracks number of rows

  • freshness: Monitors last update time (Snowflake/Redshift only)

  • custom_sql: Execute custom SQL queries

Column-Level Monitors

  • mean: Average value

  • max: Maximum value

  • min: Minimum value

  • cardinality: Number of unique values

  • null_percentage: Percentage of null values

  • unique_percentage: Percentage of unique values

Configuration Options

Here are all available configuration properties with their default values:

monitors:
  metric_name:
    # Threshold Configuration
    thresholds:
      method: automatic   # or manual
      min: null           # required if method is manual
      max: null           # required if method is manual
      sensitivity: 5      # scale 1-10, used for automatic method
      bounds: both        # or upper or lower
    
    # Schedule Configuration
    schedule:
      cadence: daily     # or hourly
      hour_utc: 0        # hour of day (0-23) for daily cadence
      frequency: 1       # run frequency in hours for hourly cadence
    
    # General Configuration
    name: ""             # custom monitor name
    description: ""      # optional description
    query: null          # required for custom_sql monitors

Complete Example

version: 2
models:
  - name: stg_orders
    meta:
      secoda:
        monitors:
          custom_sql:
            query: "SELECT AVG(amount) FROM analytics.dbt_prod.stg_orders"
            schedule:
              cadence: hourly
          row_count:
            name: "Orders Volume Monitor"
            thresholds:
              method: manual
              min: 50
              max: 500
    columns:
      - name: order_amount
        meta:
          secoda:
            monitors:
              - mean
              - max
              - null_percentage
      - name: status
        meta:
          secoda:
            monitors:
              unique_percentage: {}
              cardinality:
                thresholds:
                  method: manual
                  min: 3
                  max: 10

Monitoring Integrations

The following integrations support monitoring

  1. BigQuery

  2. Snowflake

  3. Redshift

  4. PostgreSQL

  5. Databricks

  6. SingleStore

  7. Synapse

  8. Microsoft SQL Server (MSSQL)

  9. Trino

  10. Oracle

  11. MotherDuck

  12. ClickHouse

- Define a monitor by writing your own SQL query

Adding WHERE clause
Monitor Annotations
Monitor notifications in Settings

Admins can direct monitoring notifications to specific Slack channels, distinct from other notification settings. This ensures that the right team members are alerted promptly. For detailed steps on setting this up, visit .

Example Slack notification
Custom SQL
here