Lineage
After connecting your data to Secoda, you'll be able to get a high level view of your lineage both at the table and column level.
What is Lineage?
In the context of Secoda, lineage refers to the process of tracking and documenting the relationships between different data assets within an organization. This can include information about where data comes from, how it has been transformed or modified over time, and how it is being used. Secoda automatically extracts queries to generate lineage. This helps data teams identify the downstream and upstream dependencies of a table easily.
Lineage is an important part of data governance and can help organizations understand the origin and history of their data, identify potential sources of errors or inconsistencies, and ensure that data is being used appropriately.
Overall, lineage is an important aspect of data management and can help organizations improve transparency, trustworthiness, and understanding of their data.
How to see Lineage in Secoda
Choose which resource you'd like to view the lineage for. Find it either from the Catalog in the navigation bar, or through Search.
Once on the resource page, click on the Lineage tab.
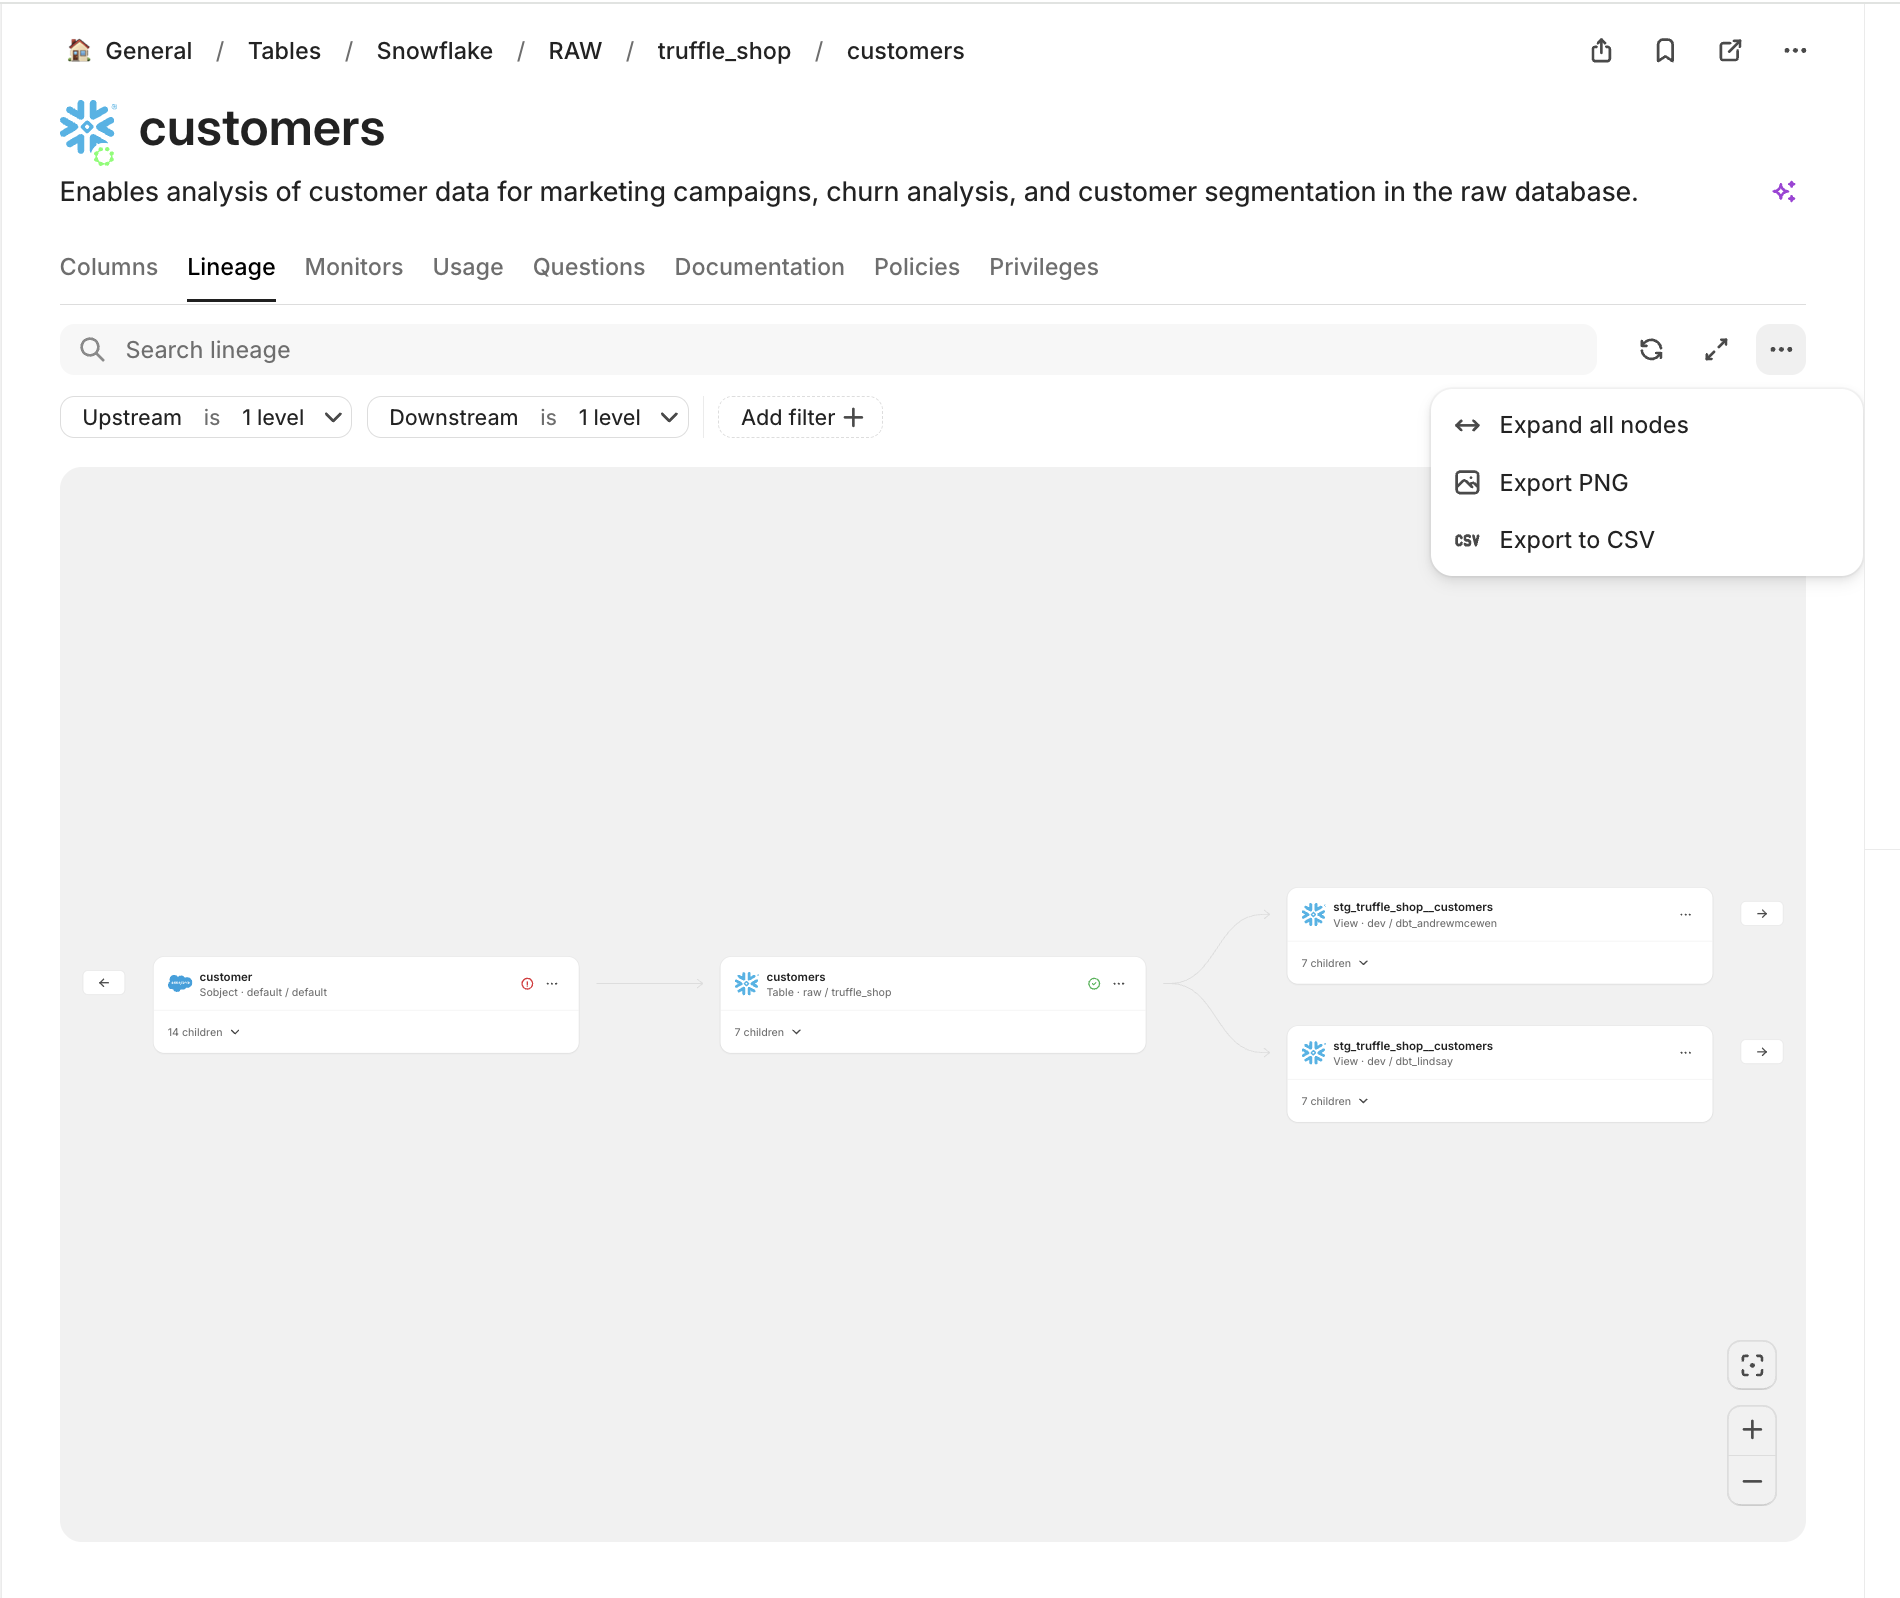
From here, you can see lineage visualized in a graph view. Click through the arrows on each node to see how the relationships are connected.
Use the Search bar to find and zoom in on a specific node, including columns. This can be helpful for larger, more complex lineage graphs.
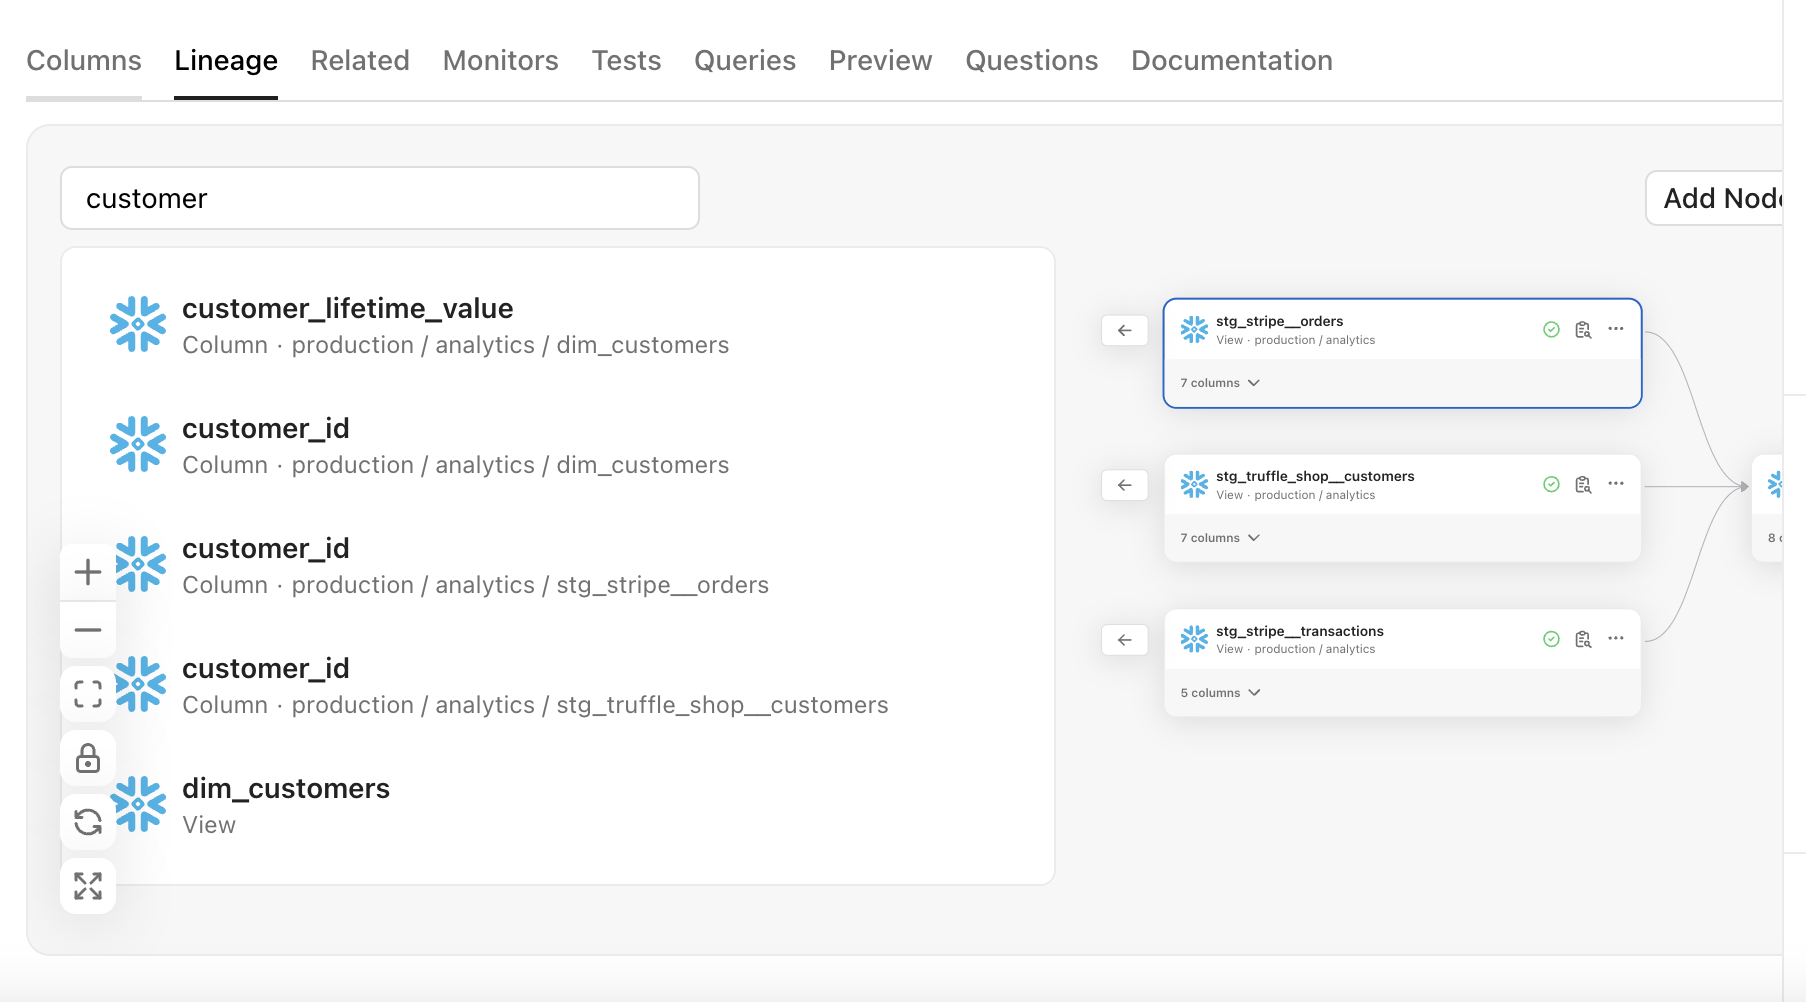
On certain resources, you can expand to see the Column Level lineage. You can search within the Columns view to drill down to find the relevant columns.
If you click into any of the columns, it opens up it's own Impact Analysis showing what is upstream and downstream of that column.
In the Data Visualization tool category, only Looker and Tableau are currently supported for column level lineage. This means that you can use the One Click Impact Analysis to see from column in a database, all the way to the impacted Dashboard or Chart in these tools.
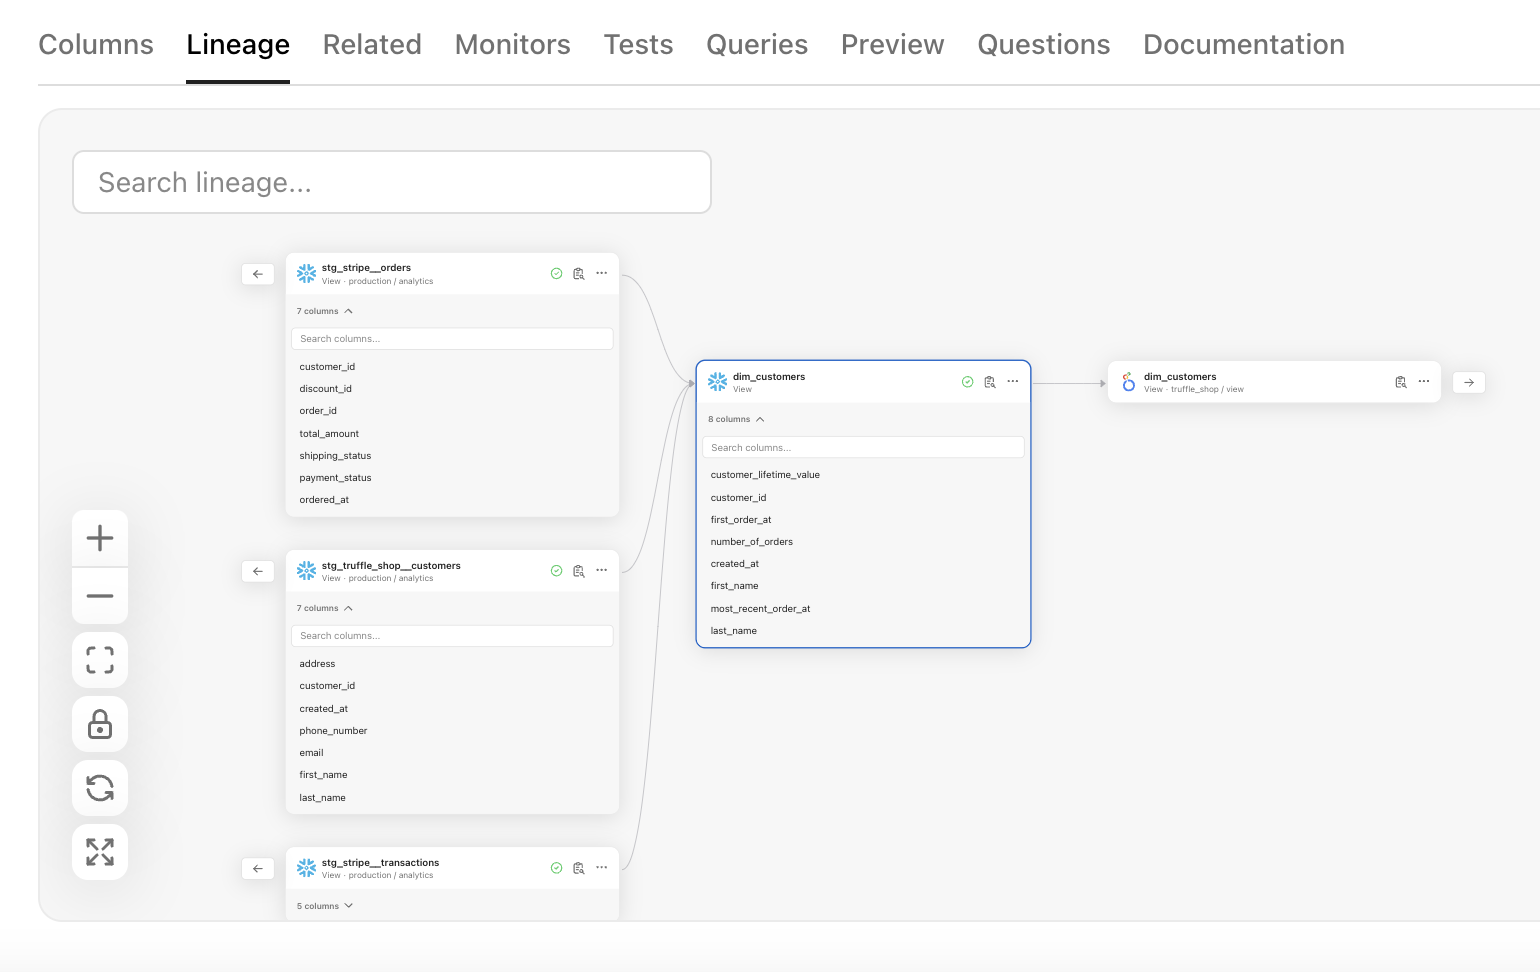
Use the Fullscreen button to get a closer view of your lineage.
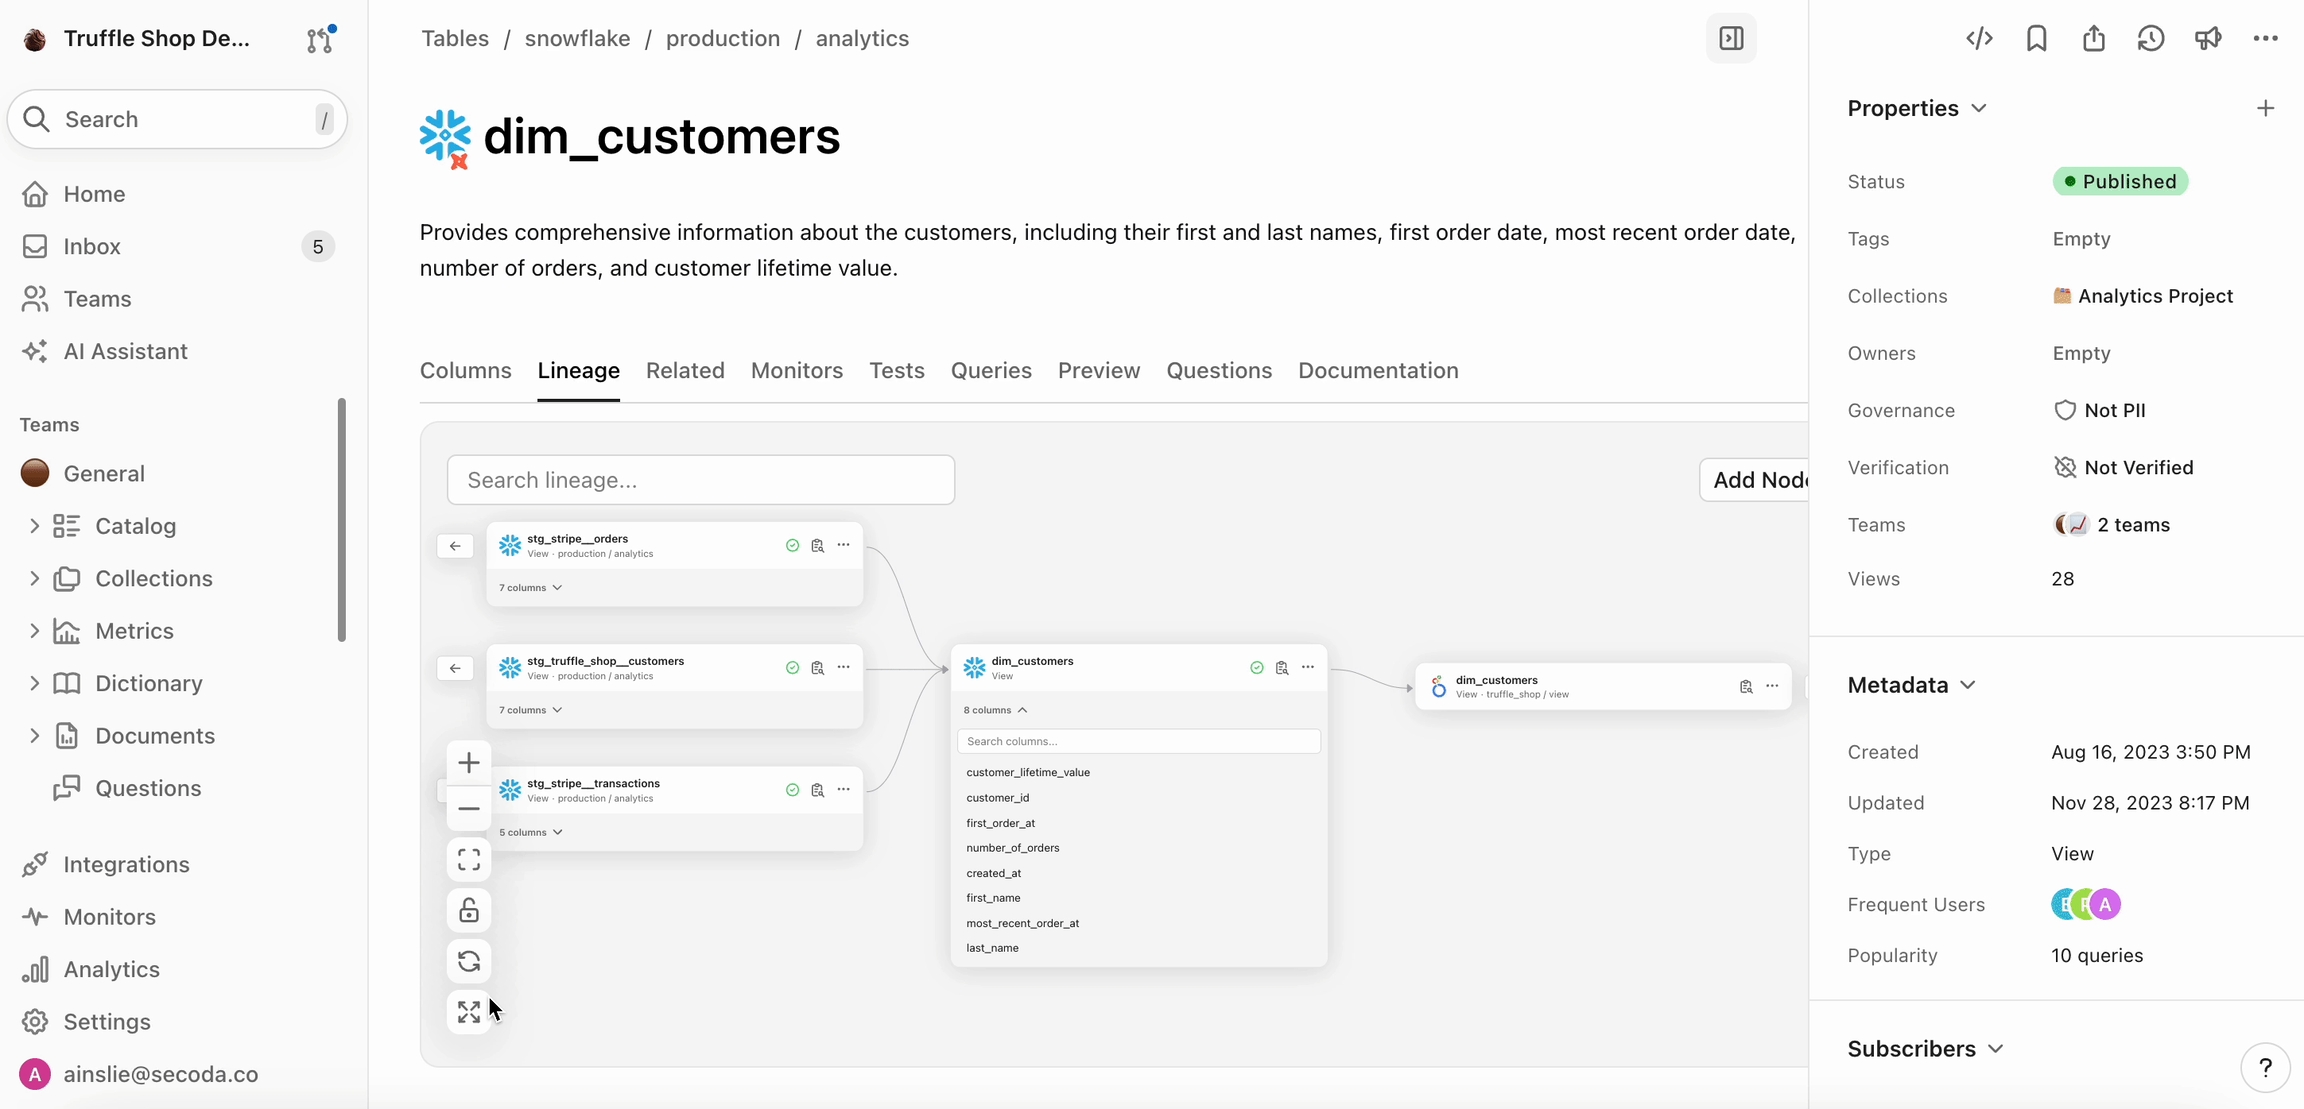
Admins can view all nodes in the lineage, including resources outside their teams. Editors and Viewers only see lineage for resources they have access to.
One-Click Impact Analysis
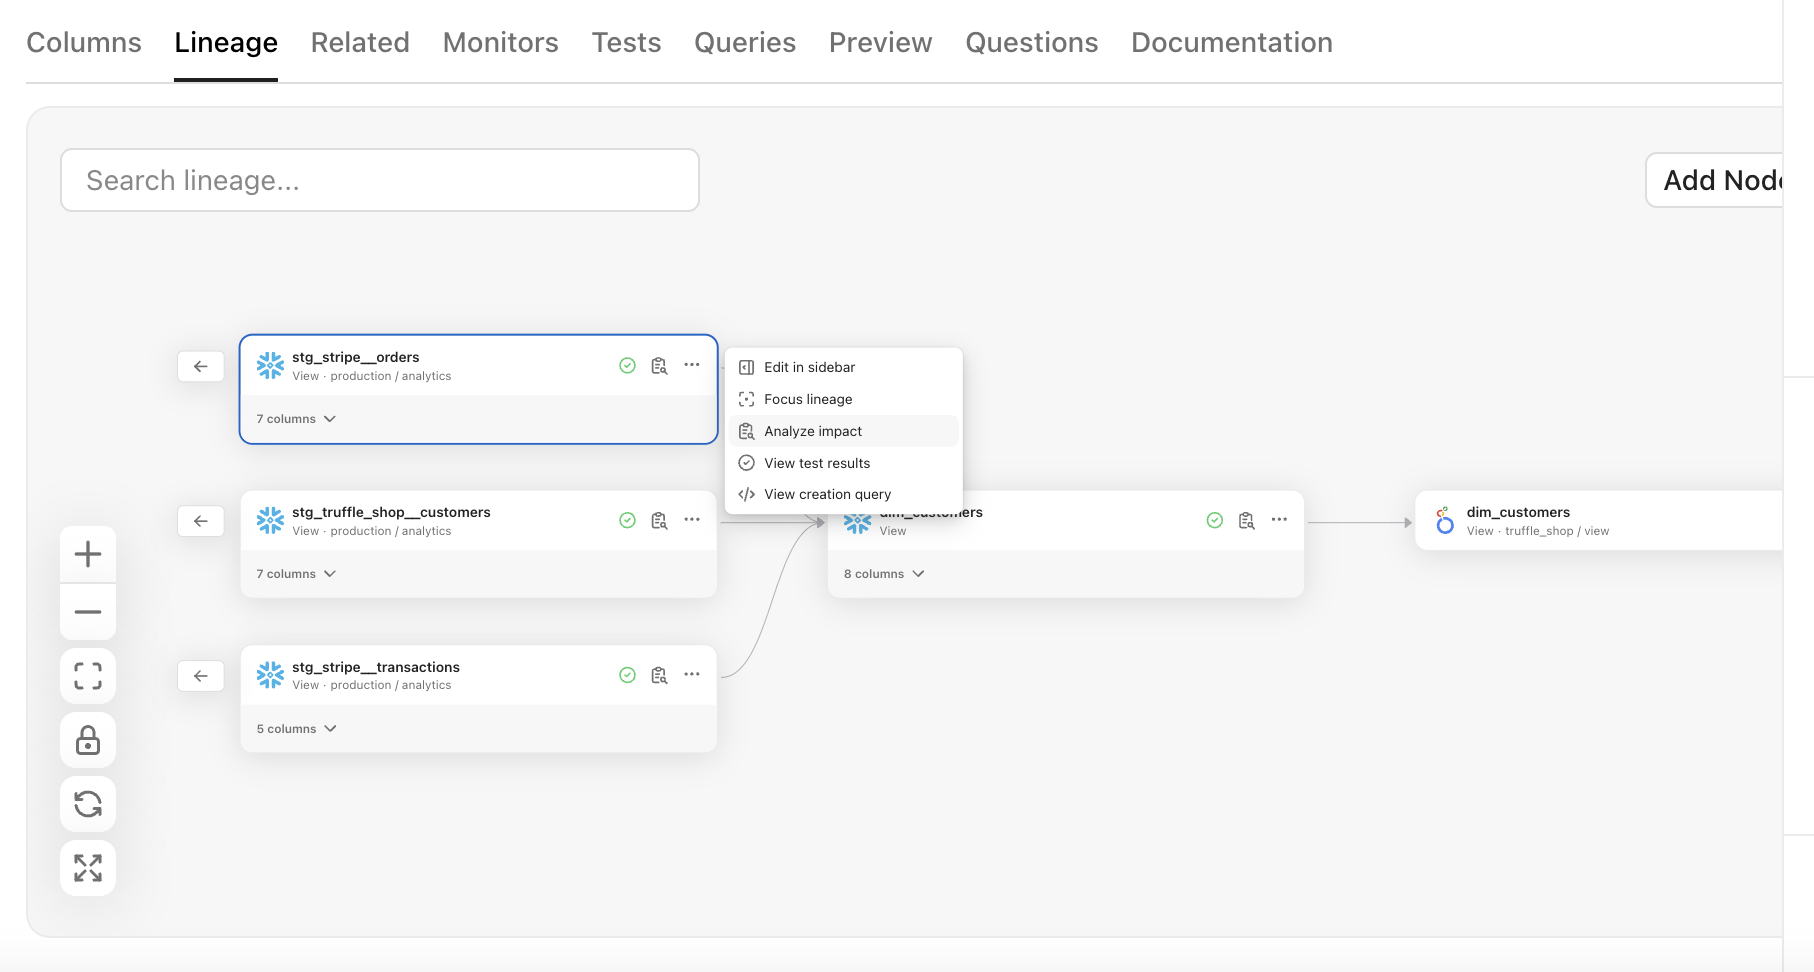
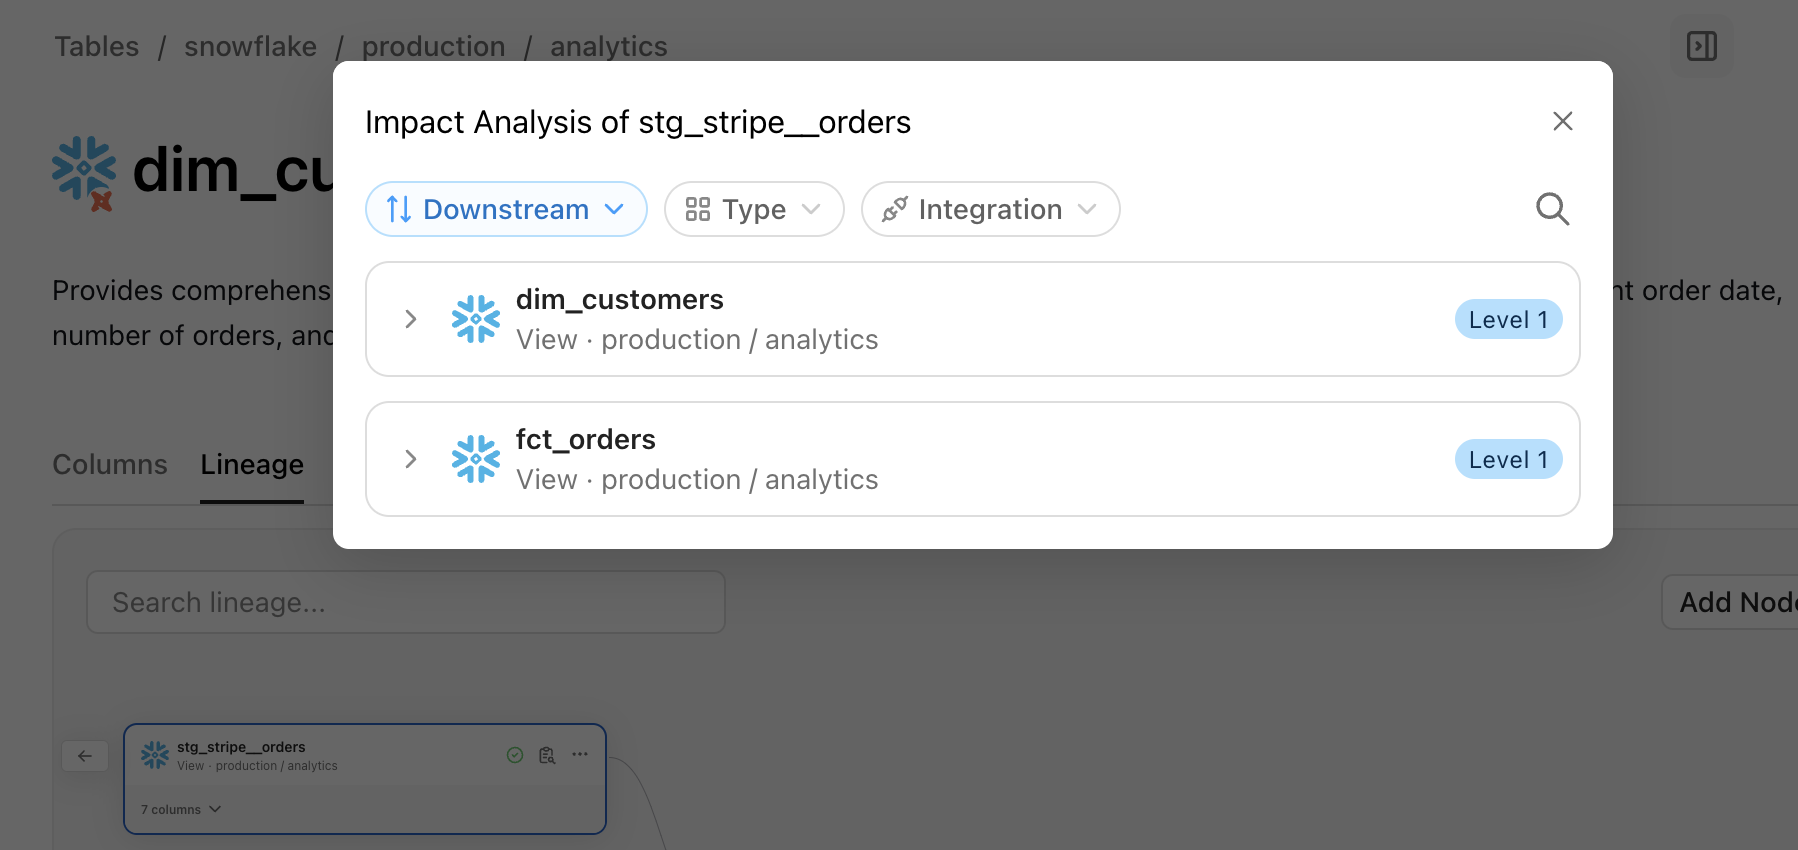
From any node, click the three dots and Analyze Impact to see a list-view of all upstream and downstream dependencies of that resource. This view makes impact analysis quick and easy with just one click.
In this view, you can filter for the type of resource and the integration you're looking for, as well as search directly.
How is Lineage Created?
When you connect a data source to Secoda, Lineage is automatically generated from SQL queries, such as:
CREATE_TABLE_AS_SELECTCREATE_VIEWMERGEJOIN
For DBT, we use the manifest.json to increase lineage coverage.
For lineage that exists between integrations or depends on another integration (e.g., dbt), make sure that the resources have been extracted during the sync so that the lineage is generated properly.
Export lineage
Interested in exporting the lineage graph that Secoda created for you? Simply click the Export PNG or Export to CSV button which will download a file of the lineage graph you are clicked into.
Not using Secoda to manage your data knowledge yet? Sign up for free here 👈
Last updated
Was this helpful?