Data quality score
Enhance your data quality with Secoda's DQS: A systematic tool to measure, track, and improve data quality.
The Data Quality Score feature is available to customers on Premium and Enterprise plans. Request access by clicking "Upgrade" under Data Quality Score in your workspace or by contacting Customer Support ([email protected]).
The Data Quality Score (DQS) in Secoda offers a comprehensive scoring system that evaluates your data's quality. Focused initially on tables, DQS not only helps teams understand their data quality but also provides actionable steps to improve their scores over time. It aggregates scores across several categories to deliver a comprehensive total out of 100%.
Benefits of DQS
Data Producers: Offers actionable steps and clear metrics to measure data quality, helping to address and reduce technical debt.
Data Consumers: Improves data discoverability and trustworthiness with transparent quality indicators.
Governance: Supplies a measurable metric to guide data governance investments, promoting a high standard of data quality.
Access to DQS motivates both data producers and consumers to uphold high data quality standards, fostering a culture of continuous improvement and accountability within your organization.
Enabling DQS
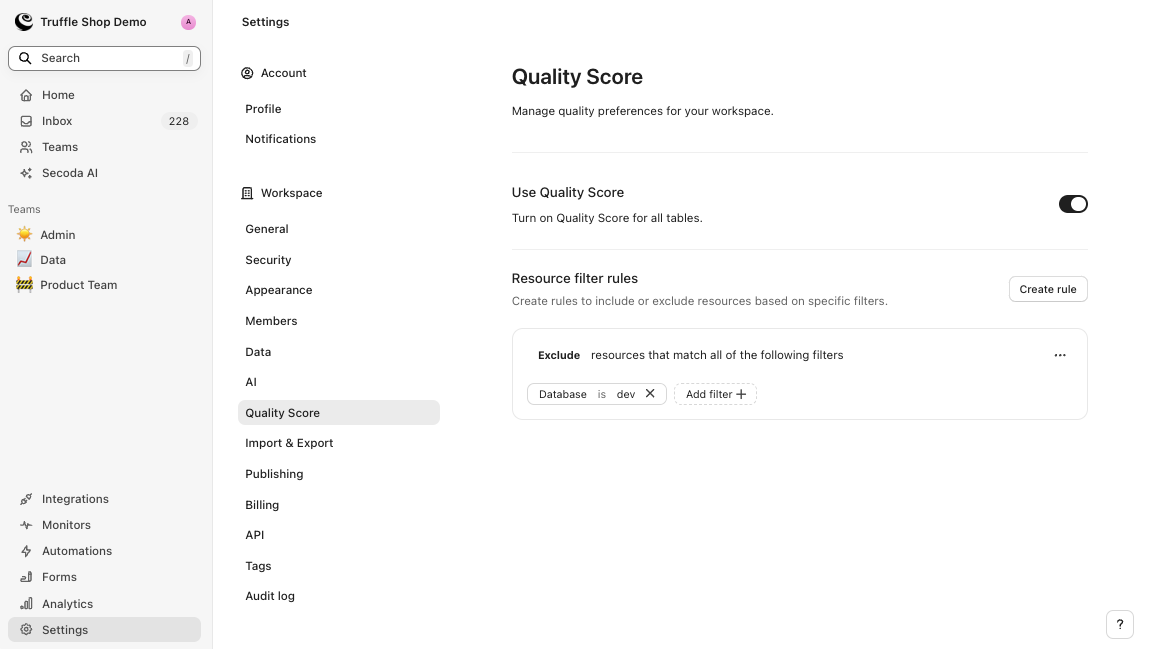
By default, DQS is enabled in all workspaces. Admins can disable it in the Quality Score settings.
Consider adjusting the Resource filter rules to selectively include or exclude specific resources from the DQS calculations. For instance, you might exclude resources from your 'dev' database, which are often incomplete and could skew the overall quality score.

Accessing and Using DQS
Table-Level Scores
Navigate to a Table: Go to the resource page of any table in your workspace.
Open the Quality Tab: Find the 'Quality' tab where the DQS is displayed.
View Score Details: Check the overall score and explore detailed breakdowns for each category.
Improve Scores: Click on specific categories to see actionable steps to enhance scores.

Tracking Changes with Analytics Reports
Open the Analytics Dashboard: Head to the Analytics section of Secoda.
Create a Quality Score Report: Use the "Add report" button to set up a new report focused on DQS.
Customize Your View: Apply filters, such as by Team, to pinpoint areas needing data quality improvements.

Search and Catalog Filters
In the Search and Catalog views, you can filter resources based on their Data Quality Score. The available quality filters are:
Is not set: No score has been assigned.
Good: Represents a high-quality score.
Moderate: Indicates average quality.
Poor: Shows a low-quality score.
These filters help you quickly identify and prioritize areas for improvement directly from your search results or catalog listings.

Automations for DQS
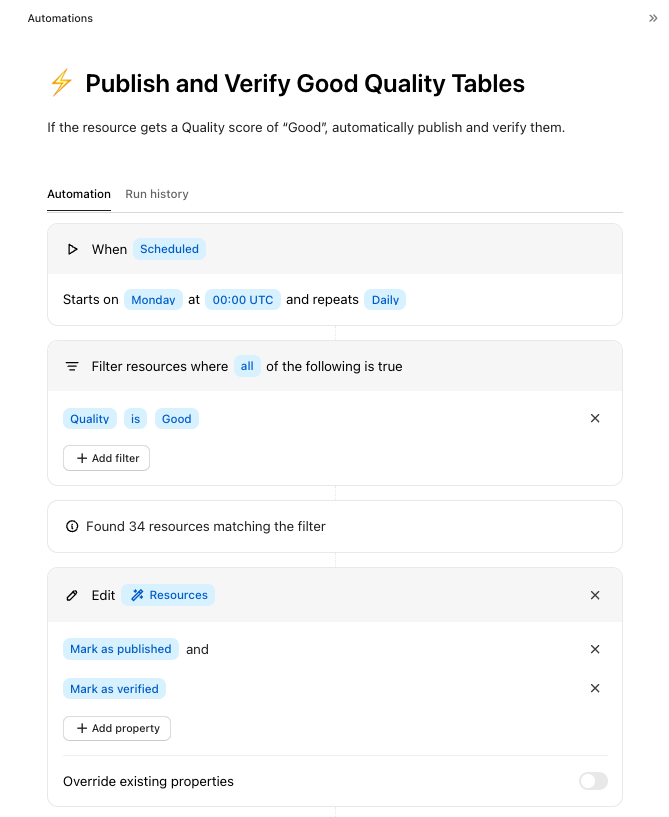
Create an Automation to automatically apply actions based on the DQS of each table. For instance, when a table achieves a "Good" quality score, the system can automatically mark it as "Published" and "Verified." This helps users quickly identify which tables are confirmed as reliable and ready for business use.

Adding a DQS Homepage Widget
Customize Your Homepage: Navigate to your personal or team-level homepage settings.
Add the DQS Widget: Select the DQS widget to add it to your homepage.
Access DQS Instantly: Enjoy quick and easy access to your data quality scores directly from the homepage.

Scoring Categories
DQS consists of four main dimensions, each reflecting essential aspects of data quality:
1. Stewardship (25 Points)
Ownership (10 Points): Full points if the table has an owner; otherwise, it scores 0.
Tagged (10 Points): Full points if the table has been tagged (e.g., PII, Verified); no tags scores 0.
Questions & Answers (5 Points): Points awarded based on the percentage of Questions on the table with answers. If no questions have been asked, full points are awarded.
2. Usability (25 Points)
Resource Description (10 Points): Full points if the table has a description; no description scores 0.
Column Descriptions (10 Points): Points awarded based on the percentage of columns with descriptions.
Schema Description (5 Points): Full points if the table schema has a description; no description scores 0.
3. Freshness (20 Points)
Freshness Monitor Set (10 Points): Full points awarded if a freshness monitor is set; otherwise, it scores 0.
Freshness Passing (10 Points): Full points if the data freshness is within the expected period; otherwise, it scores 0.
4. Accuracy (30 Points)
The Accuracy score integrates results from Secoda Monitors or 3rd party tests like dbt, Monte Carlo and Great Expectations.
Nullness (10 Points):
5 points awarded if a nullness test is configured for the table; otherwise, it scores 0.
Points awarded based on the percentage of passing nullness tests.
Uniqueness (10 Points):
5 points awarded if a uniqueness test is configured for the table; otherwise, it scores 0.
Points awarded based on the percentage of passing uniqueness tests.
Other Tests (10 Points): Additional points based on the percentage of other tests passing.
Feedback
We welcome your suggestions for enhancing DQS. If you have any feedback to help us evolve this tool to better meet your needs, please let us know at [email protected].
Last updated
Was this helpful?