> For the complete documentation index, see [llms.txt](https://docs.secoda.co/llms.txt). Markdown versions of documentation pages are available by appending `.md` to page URLs; this page is available as [Markdown](https://docs.secoda.co/features/queries/extracted-queries.md).
# Extracted queries
Secoda seamlessly extracts queries directly from an integration, pulling both the Query History and the Creation Query for each resource.
## Query History
By clicking on the Queries tab from a resource in Secoda, you can access the resource's query history. Query history is extracted from the following integrations:
* [Snowflake](/integrations/data-warehouses/snowflake-integration.md)
* [Redshift](/integrations/data-warehouses/redshift-integration.md)
* [BigQuery](/integrations/data-warehouses/bigquery-integration.md)
* [Databricks](/integrations/data-warehouses/databricks-integration.md)
### How Secoda Extracts Queries
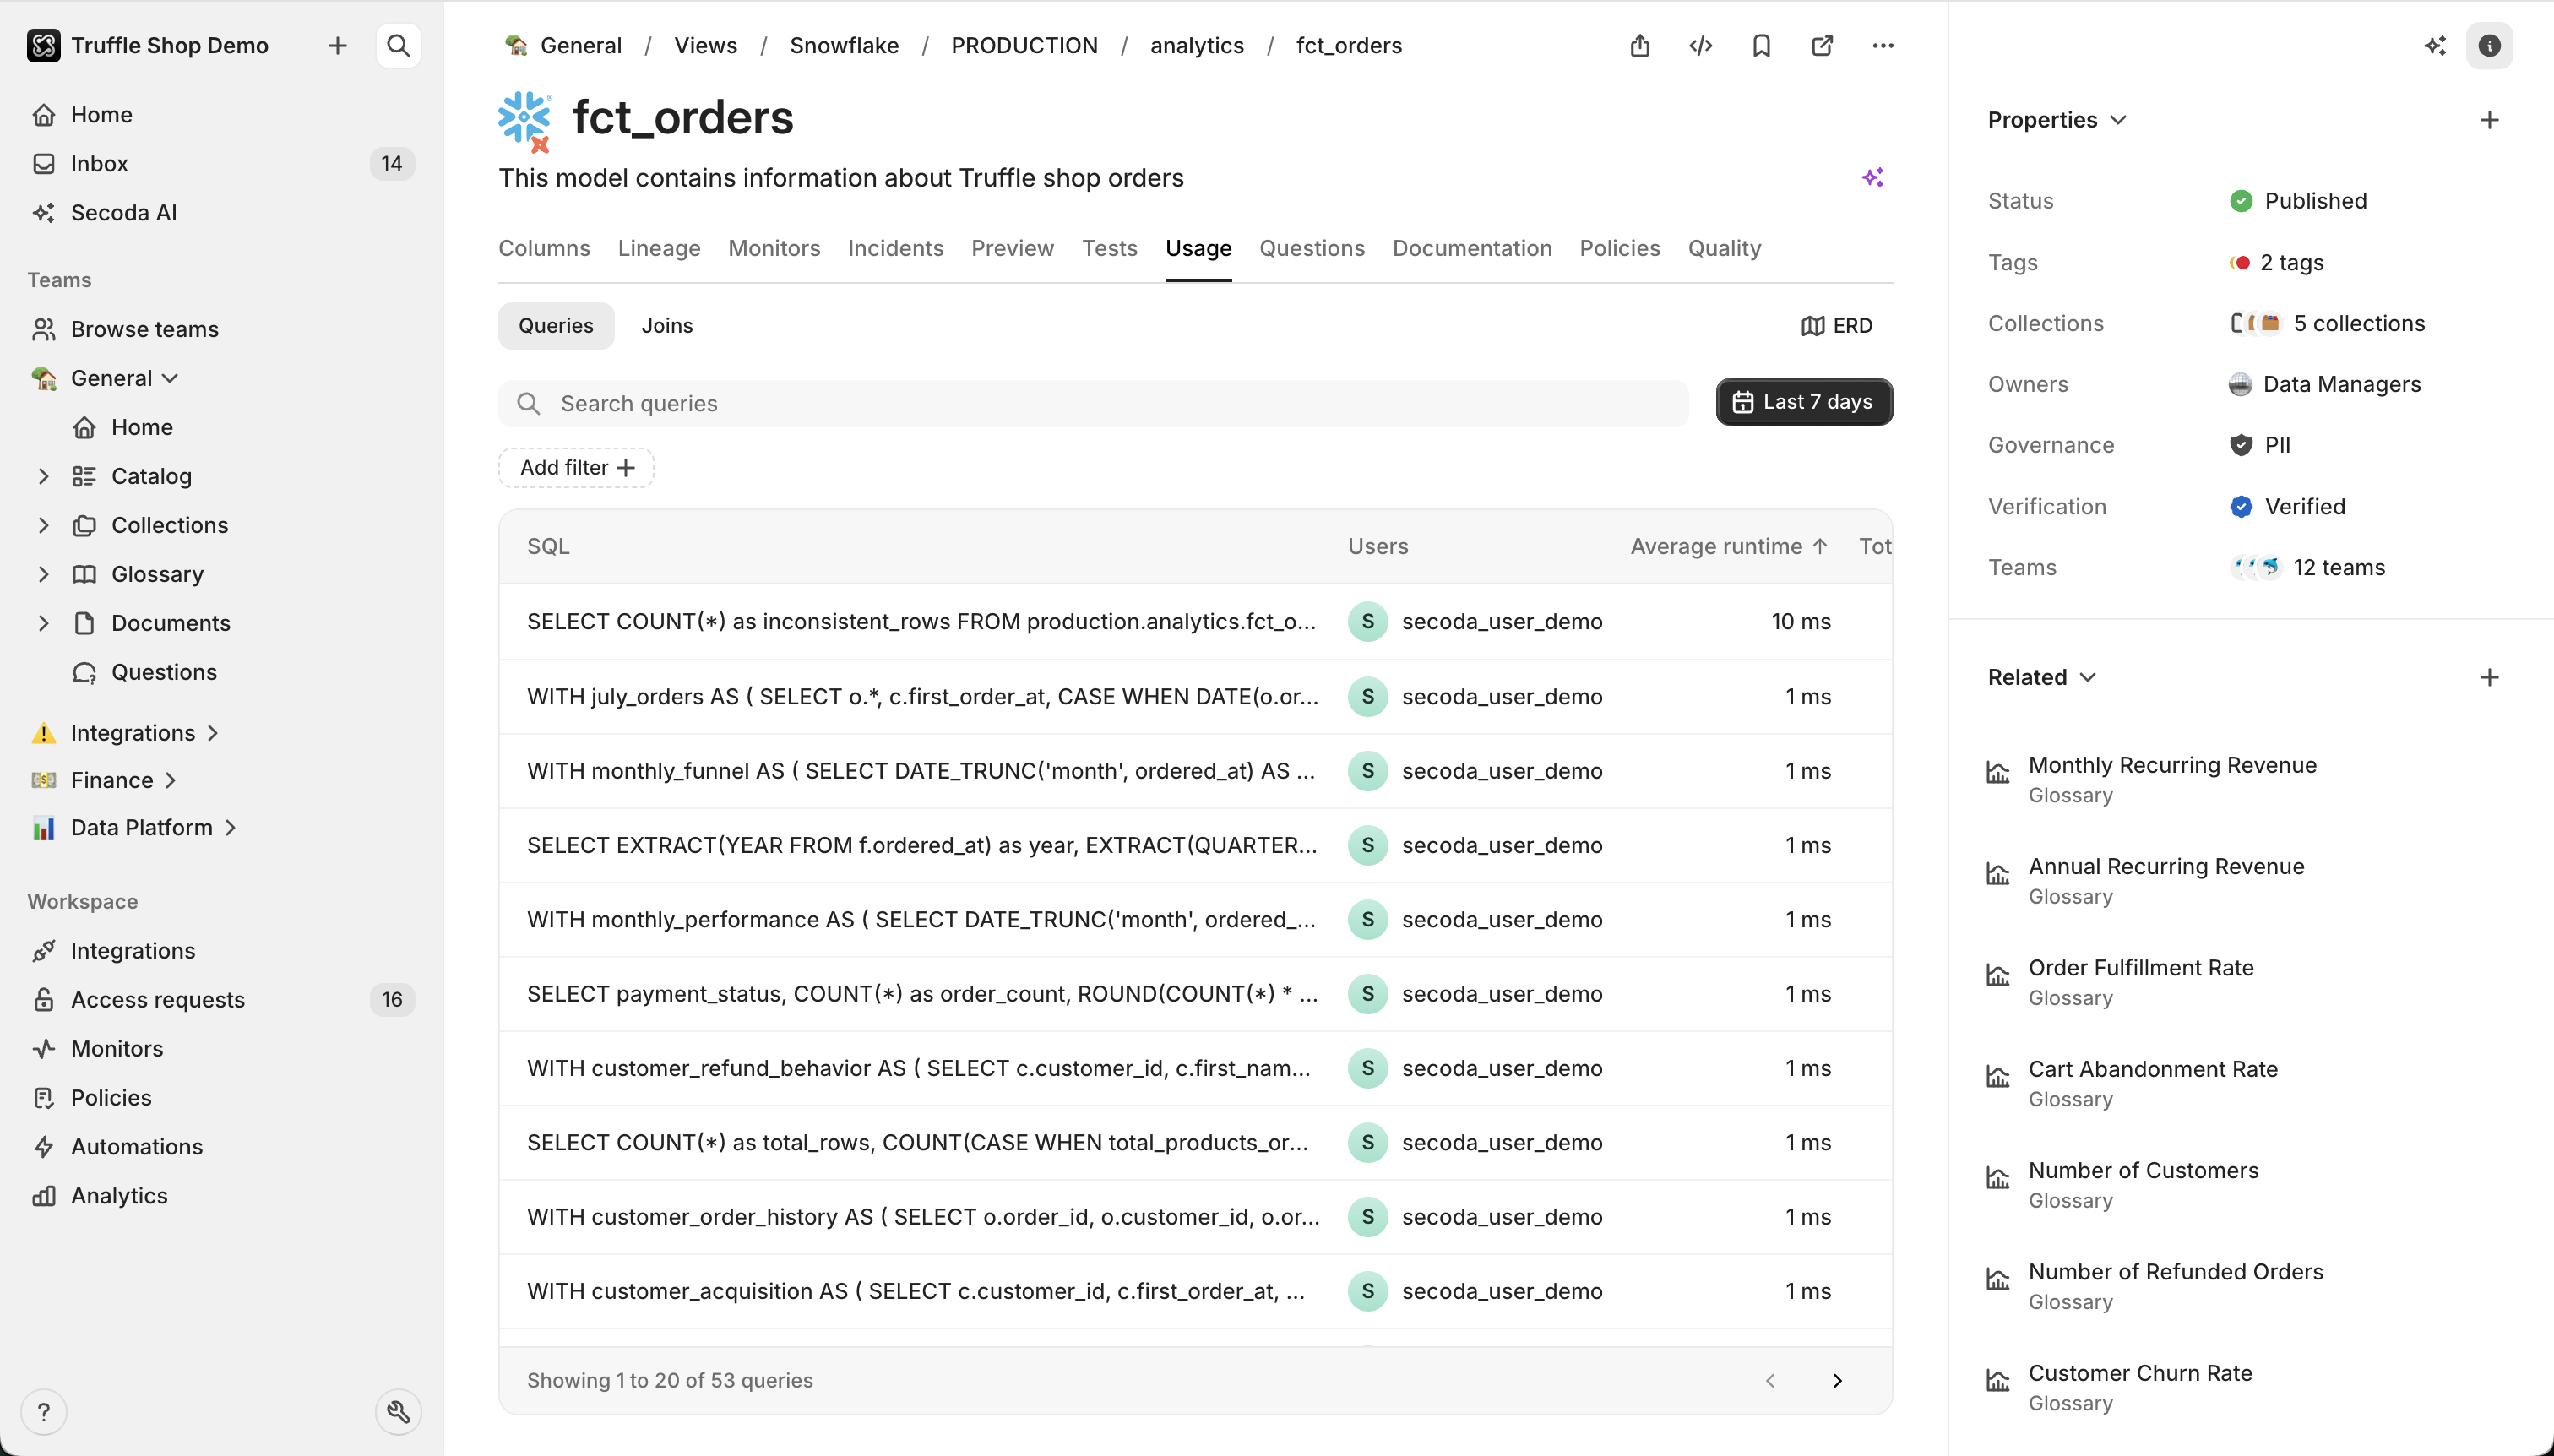
During the extraction process, Secoda retrieves the queries since the last integration sync run, or a maximum of 30 days, directly from the integration. Any new, previously unseen queries are added to the list of queries associated with that resource in Secoda. This comprehensive list can be found under the Queries tab on the resource page, as shown below.
### How to Access Queries Run on a Resource
To view detailed information about queries run on a specific resource, follow these steps:
1. **Locate the Resource**:
* Click into a resource from the Catalog, or find it using the Search function.
2. **Navigate to the Queries Tab**:
* Once you are on the resource page, go to the "Queries" tab.
3. **Review Query Information**:
* For each query run on the resource, you will see the following details:
* **SQL Query**: The full query executed on the resource from the integration source.
* **Average Runtime**: The average amount of time it takes to run the query.
* **Total Runtime**: The total amount of run time in the past 24 hours.
* **Total Runs**: The number of times the query has been run in the past 24 hours.
* **Users**: The user(s) who have executed this query.
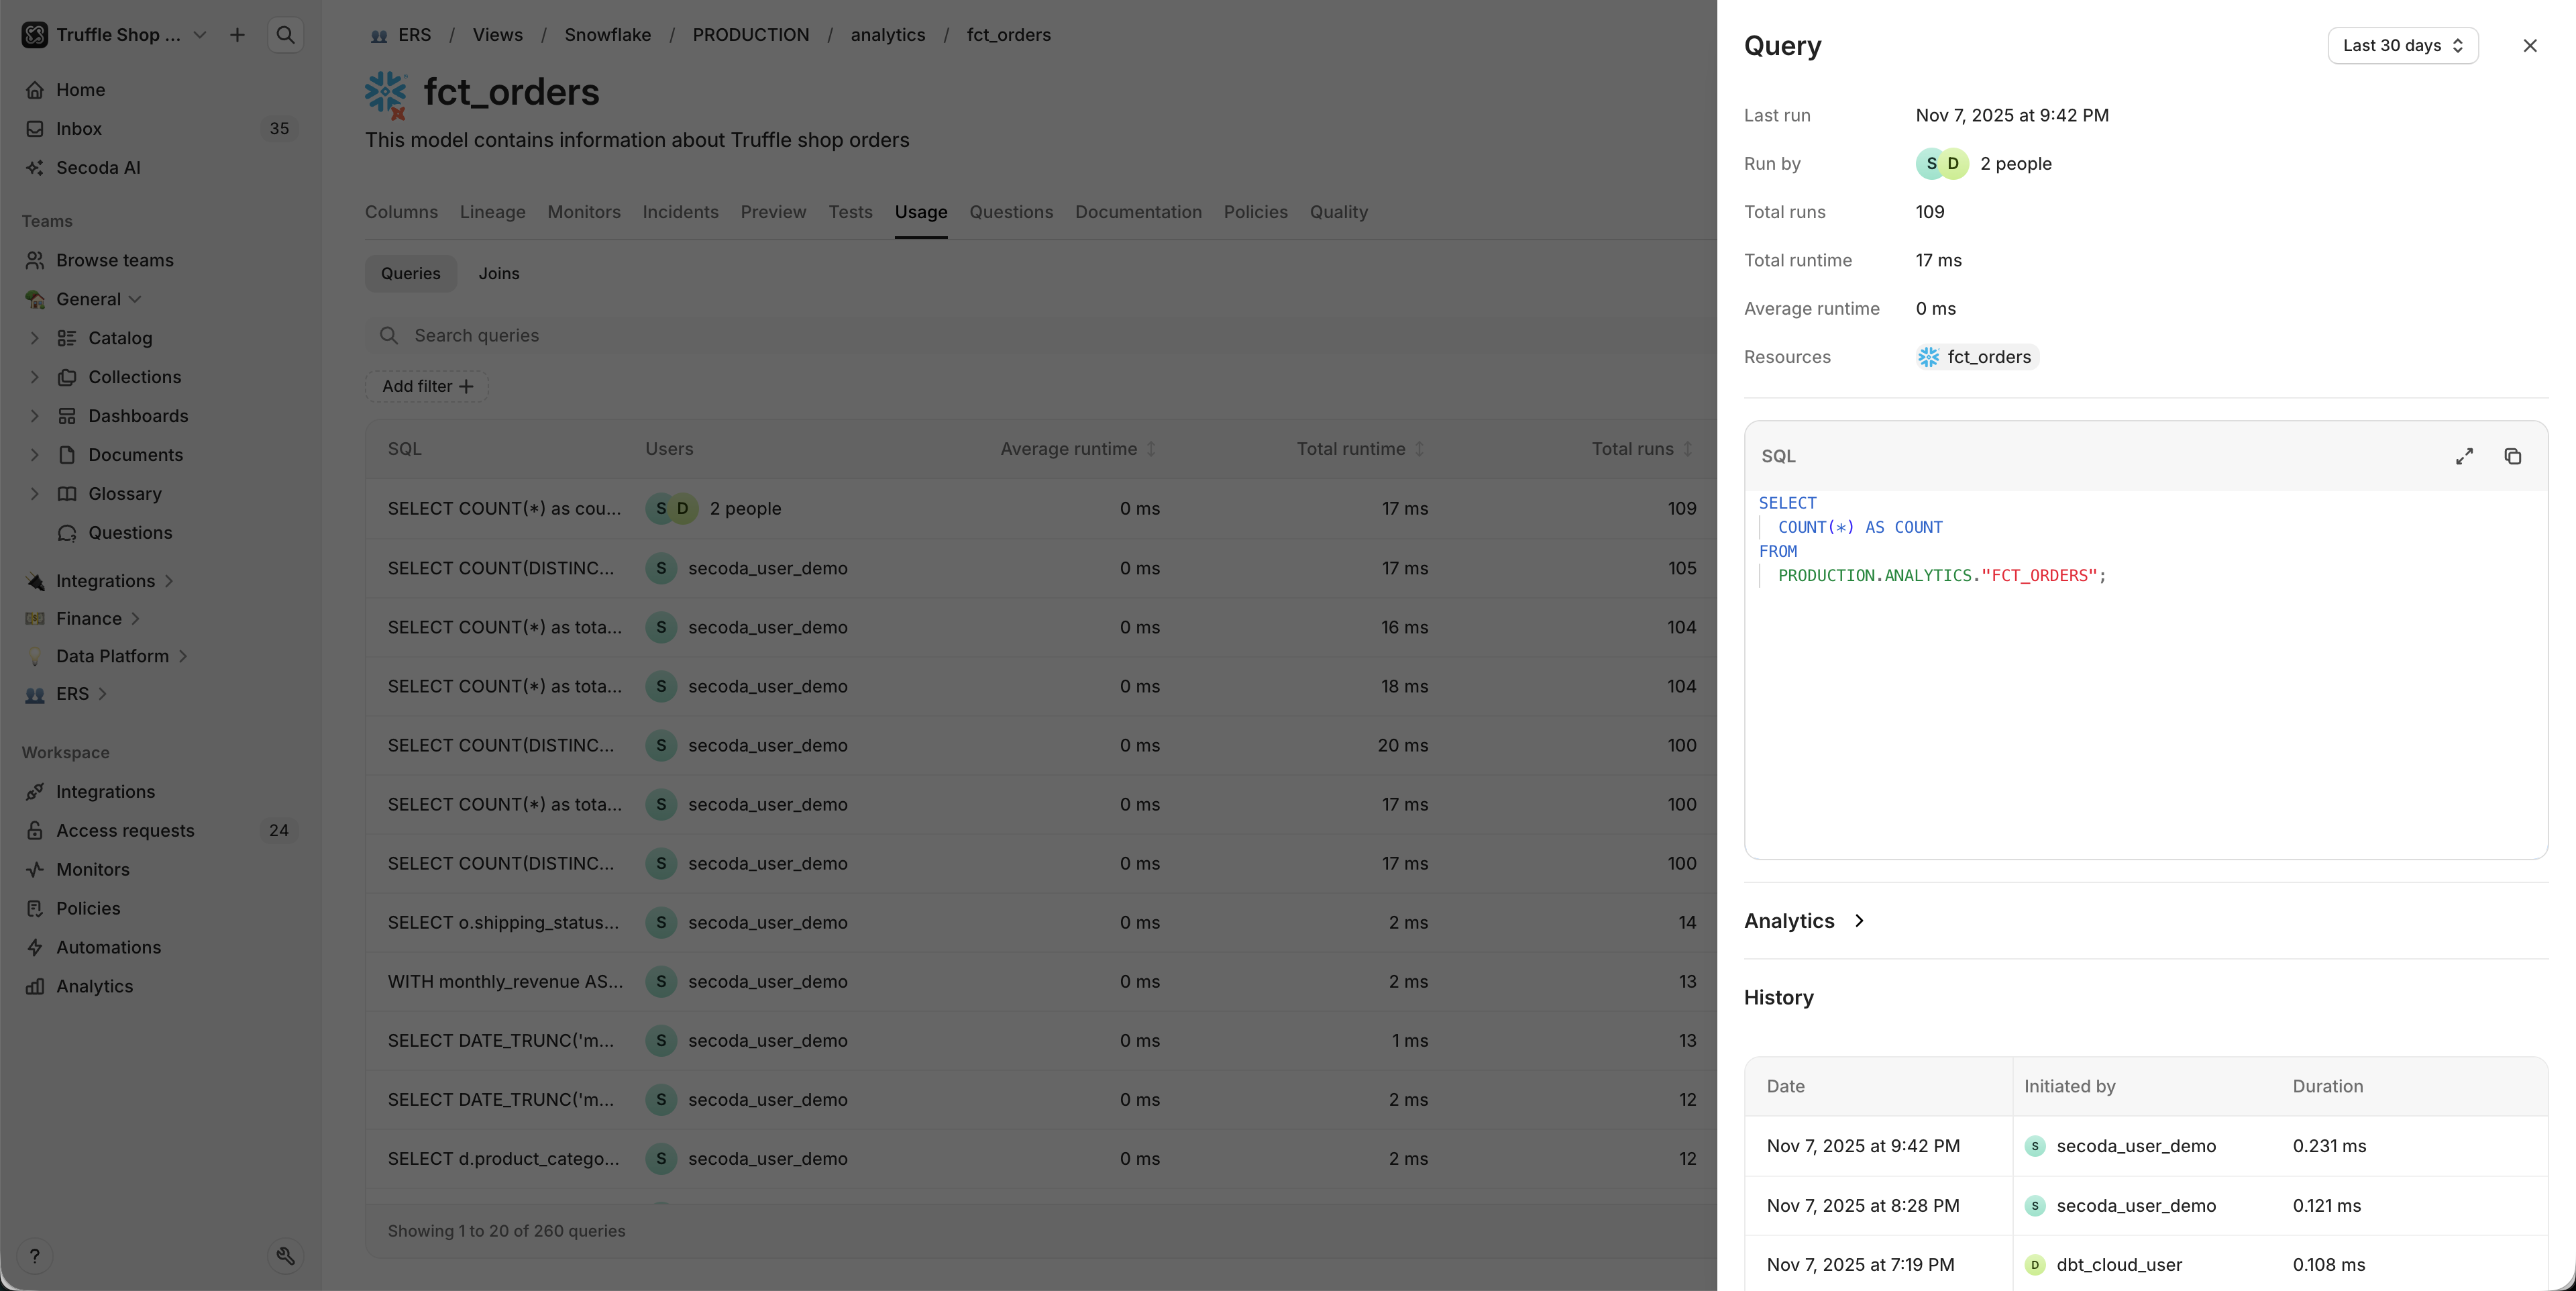
4. **Explore the Query Summary**:
* Click on a query to access the Query Summary, where you can:
* **Visual Analytics**: View visual analytics related to the specific query.
* **Query History**: See the query history, including date, user, runtime, and cost details.
* **Referenced Resources**: View the list of resources that the query references.
* **Filter History**: Filter the history to see data from the last 30 days, 7 days, or 1 day.
{% hint style="info" %}
Queries can easily be copied, and run directly in Secoda through the [Query editor within a document](/features/queries/running-queries-in-secoda.md).
{% endhint %}
### How to Access All Queries within the last 30 days
To view a comprehensive list of all extracted queries within the last 30 days across all resources in Secoda, follow these steps:
1. **Open the Command Palette**:
* Press `CMD + K` on your keyboard.
2. **Search for "Queries"**:
* In the command palette, type "Queries" or scroll to select the "Queries" option.
3. **Utilize the Aggregate Queries Page**:
* On the aggregate queries page, you can:
* **Search**: Use the search bar to find specific queries.
* **Analyze Runtime**: Look at the Average Runtime column to identify the slowest running queries. This can help you pinpoint areas for optimization.
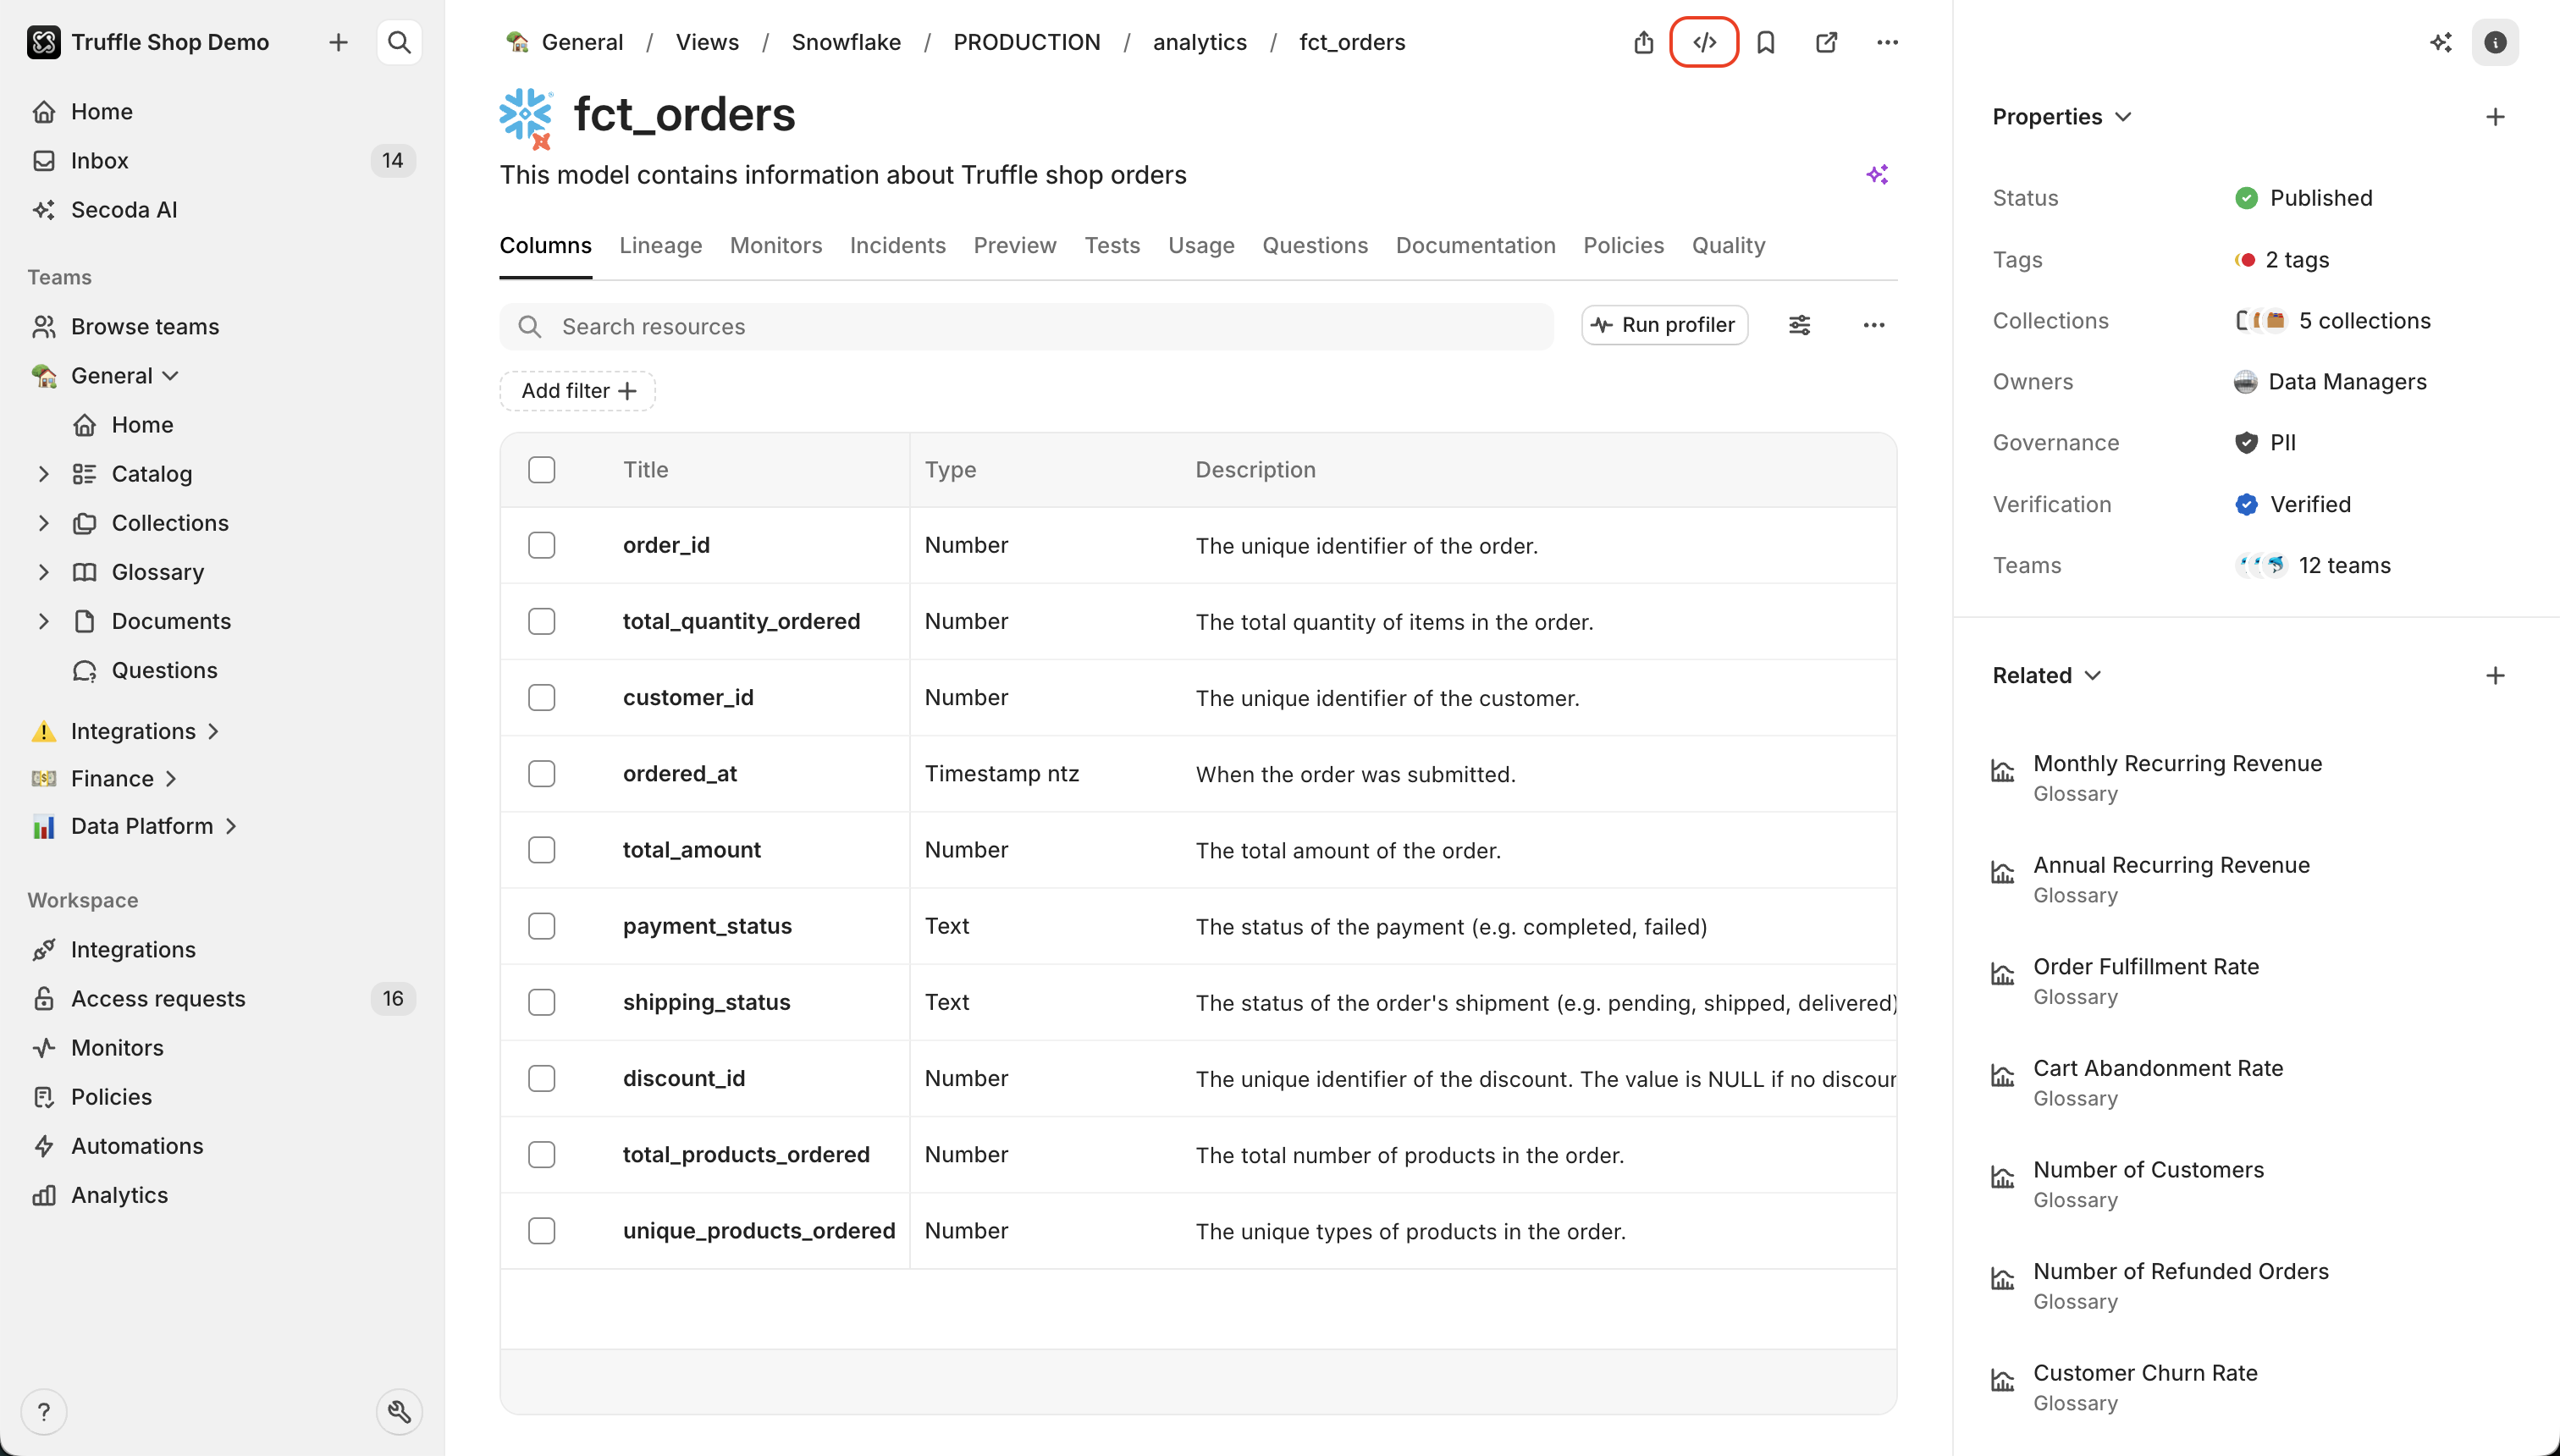
## Creation queries
For resources created from a query (e.g., Views), the Creation Query can be found by clicking the `` icon in the top right-hand corner. This query can also be copied for easy reuse.
---
# Agent Instructions
This documentation is published with GitBook. GitBook is the documentation platform designed so that both humans and AI agents can read, navigate, and reason over technical content effectively. Learn more at gitbook.com.
## Querying This Documentation
If you need additional information that is not directly available in this page, you can query the documentation dynamically by asking a question.
Perform an HTTP GET request on the current page URL with the `ask` query parameter, and the optional `goal` query parameter:
```
GET https://docs.secoda.co/features/queries/extracted-queries.md?ask=&goal=
```
`ask` is the immediate question: it should be specific, self-contained, and written in natural language.
`goal` is optional and describes the broader end goal you are ultimately trying to accomplish on behalf of the user. GitBook uses it to tailor the answer towards what is most useful for that goal.
The response will contain a direct answer to the question and relevant excerpts and sources from the documentation.
Use this mechanism when the answer is not explicitly present in the current page, you need clarification or additional context, or you want to retrieve related documentation sections.