> For the complete documentation index, see [llms.txt](https://docs.secoda.co/llms.txt). Markdown versions of documentation pages are available by appending `.md` to page URLs; this page is available as [Markdown](https://docs.secoda.co/features/column-profiling.md).
# Column profiling
Column profiling is a process of analyzing the characteristics and patterns of data within a specific column or field in a data set. Column profiling can be used to identify data quality issues and help organizations improve the quality of their data.
There are several benefits to column profiling for data quality:
1. Improved data accuracy: Column profiling can help identify data errors or inconsistencies within a specific column, allowing organizations to correct these issues and improve the overall accuracy of their data.
2. Enhanced data integrity: By identifying data quality issues within a specific column, organizations can take steps to ensure that data is being entered and stored correctly, improving data integrity.
3. Improved data governance: Column profiling can help organizations identify and address data quality issues, improving data governance and reducing the risk of errors or misunderstandings.
4. Enhanced data trustworthiness: By identifying and correcting data quality issues, organizations can improve the trustworthiness of their data, making it more useful and reliable for decision-making and analysis.
## How it works
Column profiling runs a `SELECT` query directly on the database/data warehouse, processing the data to quickly determine the distribution of your data including any null values, Minimum, Maximum, the column count, and number of unique columns.
The processed data will **not** be saved. As soon as the calculations are complete, we save the metadata results, but the data itself that the calculation is done on is not persisted anywhere in our database.
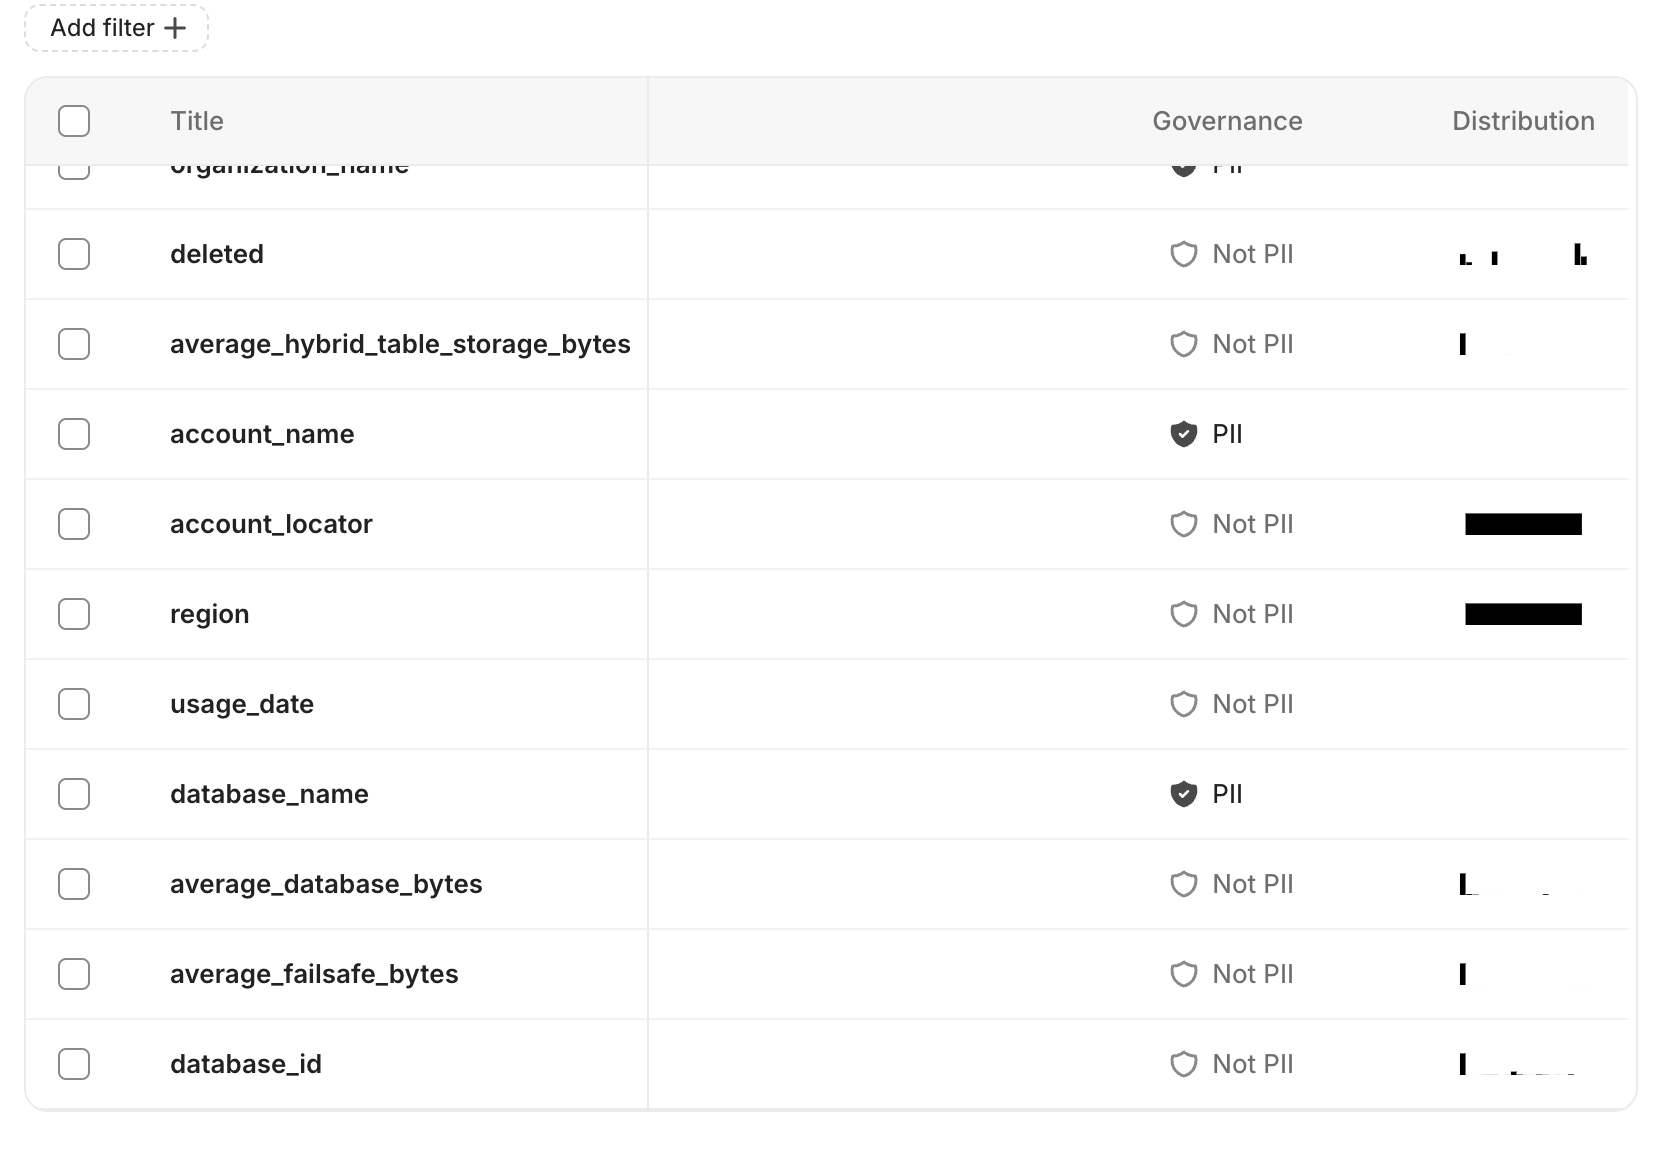
Profilers exclude PII data.
The overall goal is to gain a feel for the quality of the dataset, and from here you can determine if you'd like to set monitors on certain tables/columns to further track data quality issues. Read more about our Monitoring capabilities here: [Monitors](/features/monitoring.md)
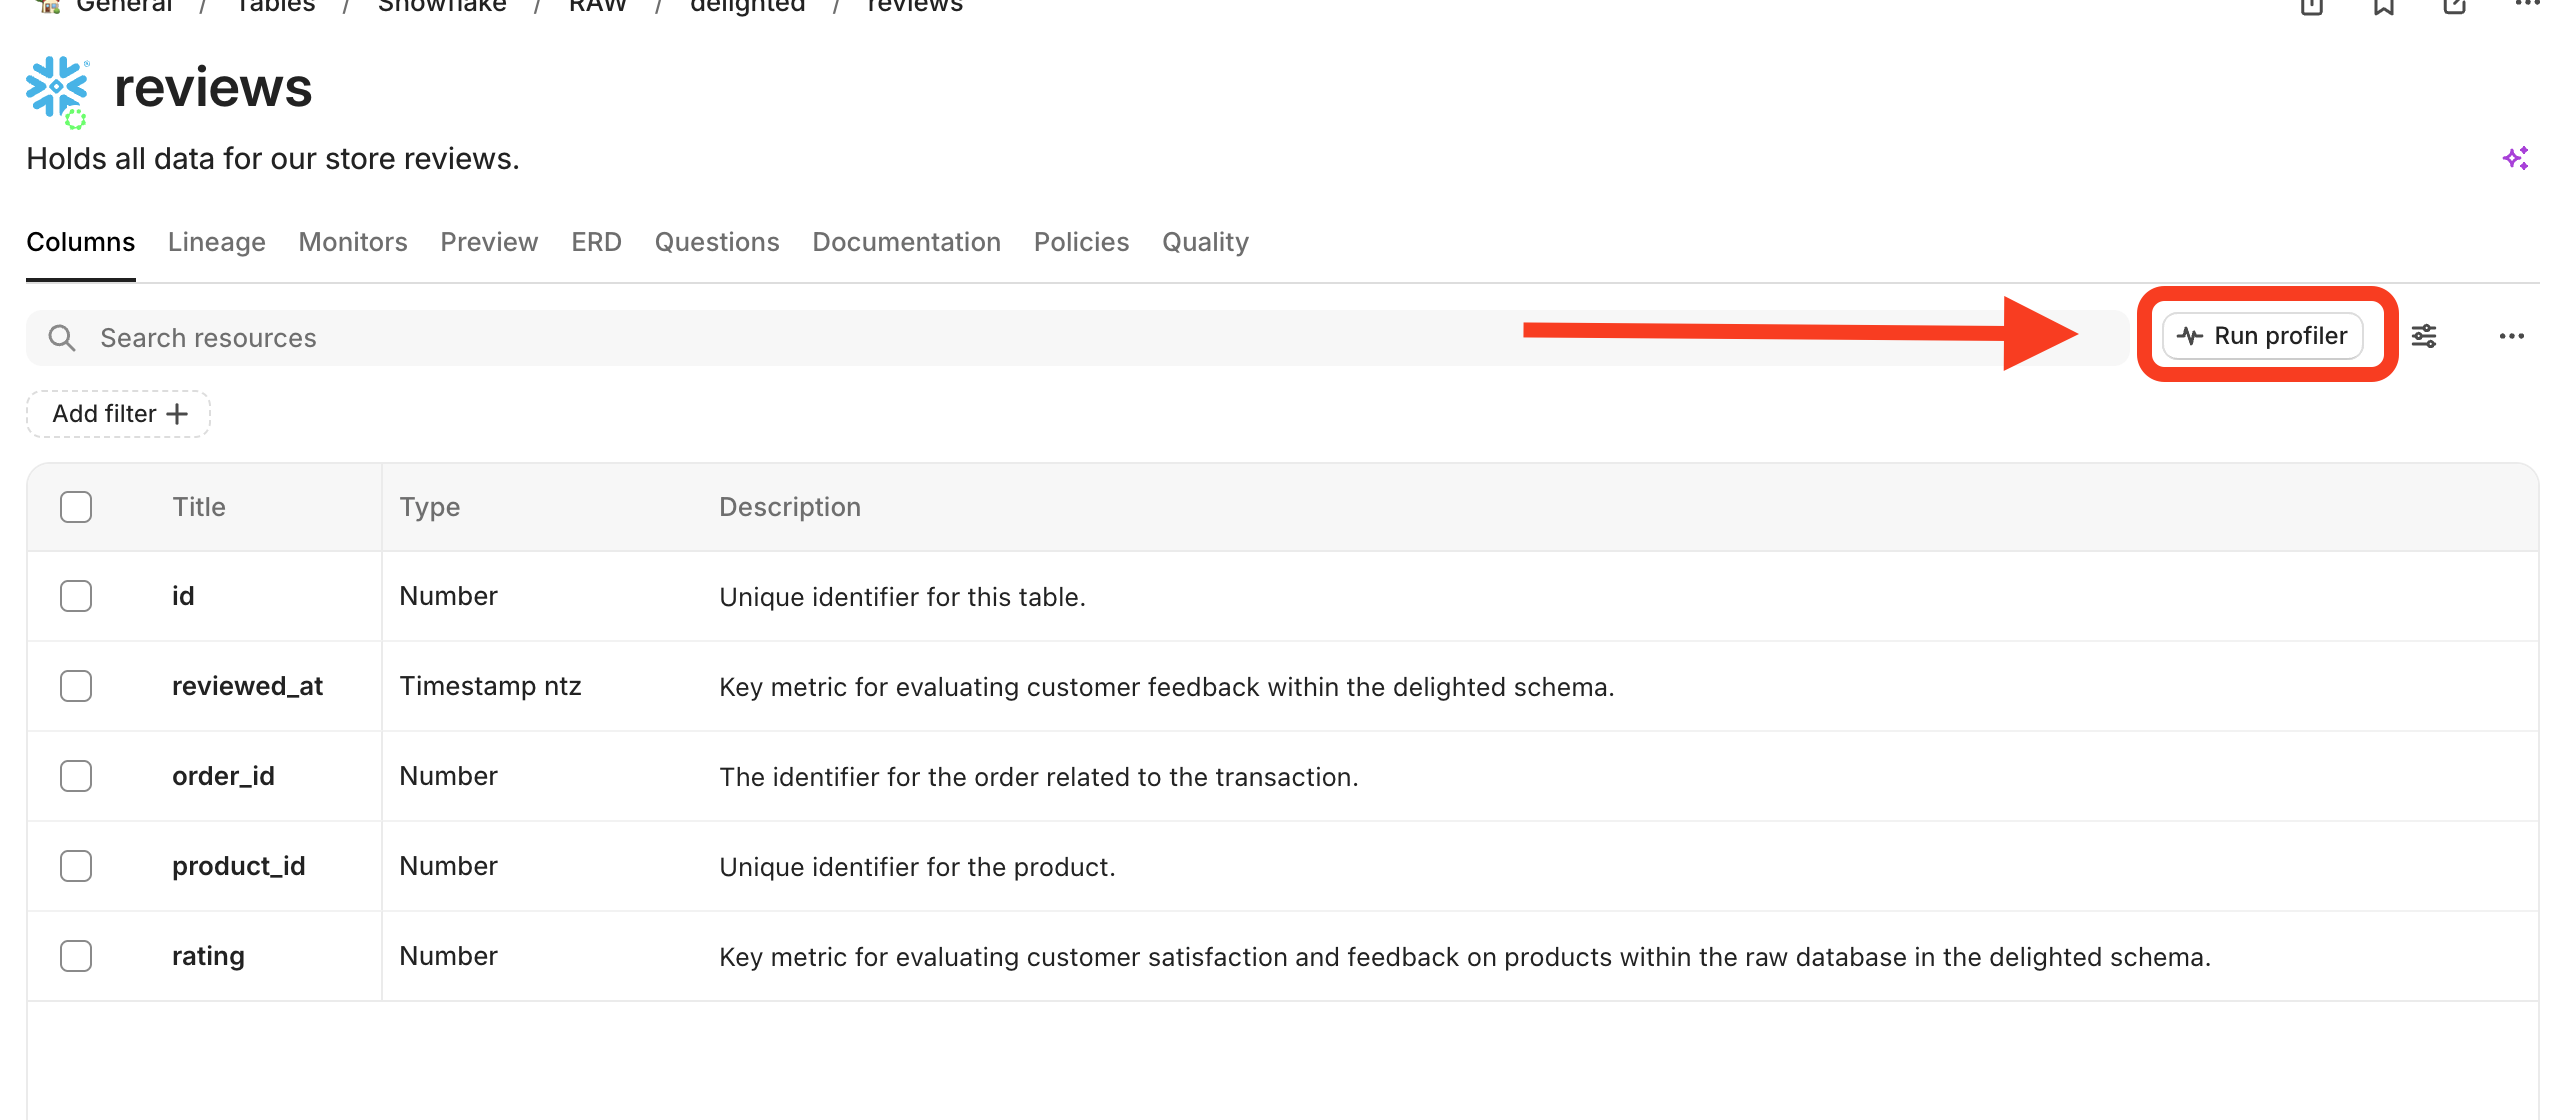
## **How to run column profiling**
1. Click Run profiler from any table (double check that we support column profiling for the integration in the nested[ metadata extracted docs](/integrations.md)) \\
2. See the distribution visualization and hover over for frequency info\\
3. Double click into the visualization too see additional details like min, max, mode, unique values etc.
{% hint style="info" %}
Not using Secoda to manage your data documentation yet? Sign up for free [here](http://app.secoda.co/) 👈
{% endhint %}
---
# Agent Instructions
This documentation is published with GitBook. GitBook is the documentation platform designed so that both humans and AI agents can read, navigate, and reason over technical content effectively. Learn more at gitbook.com.
## Querying This Documentation
If you need additional information that is not directly available in this page, you can query the documentation dynamically by asking a question.
Perform an HTTP GET request on the current page URL with the `ask` query parameter, and the optional `goal` query parameter:
```
GET https://docs.secoda.co/features/column-profiling.md?ask=&goal=
```
`ask` is the immediate question: it should be specific, self-contained, and written in natural language.
`goal` is optional and describes the broader end goal you are ultimately trying to accomplish on behalf of the user. GitBook uses it to tailor the answer towards what is most useful for that goal.
The response will contain a direct answer to the question and relevant excerpts and sources from the documentation.
Use this mechanism when the answer is not explicitly present in the current page, you need clarification or additional context, or you want to retrieve related documentation sections.