> For the complete documentation index, see [llms.txt](https://docs.secoda.co/llms.txt). Markdown versions of documentation pages are available by appending `.md` to page URLs; this page is available as [Markdown](https://docs.secoda.co/integrations/data-warehouses/snowflake-integration/native-snowflake.md).
# Snowflake Native App
{% hint style="info" %}
The Secoda Snowflake Native App is currently in early access. Features and functionality may change before the full release.
{% endhint %}
The Secoda Native Snowflake App enables you to integrate your Snowflake warehouse with Secoda without providing direct access to your Snowflake account. The native application runs securely within your Snowflake environment.
{% hint style="info" %}
The Secoda Native App processes your data within your Snowflake environment and only sends metadata and limited processed information to Secoda's servers, allowing you to use Secoda's features without providing direct access to your raw data.
{% endhint %}
## Installation Process
To get started with the Secoda Native Snowflake App, follow these four steps:
1. Install the native app from Snowflake Marketplace
2. Configure the application's connection credentials
3. Set up network rules (if required)
4. Complete the setup process
### 1. Installing from Marketplace
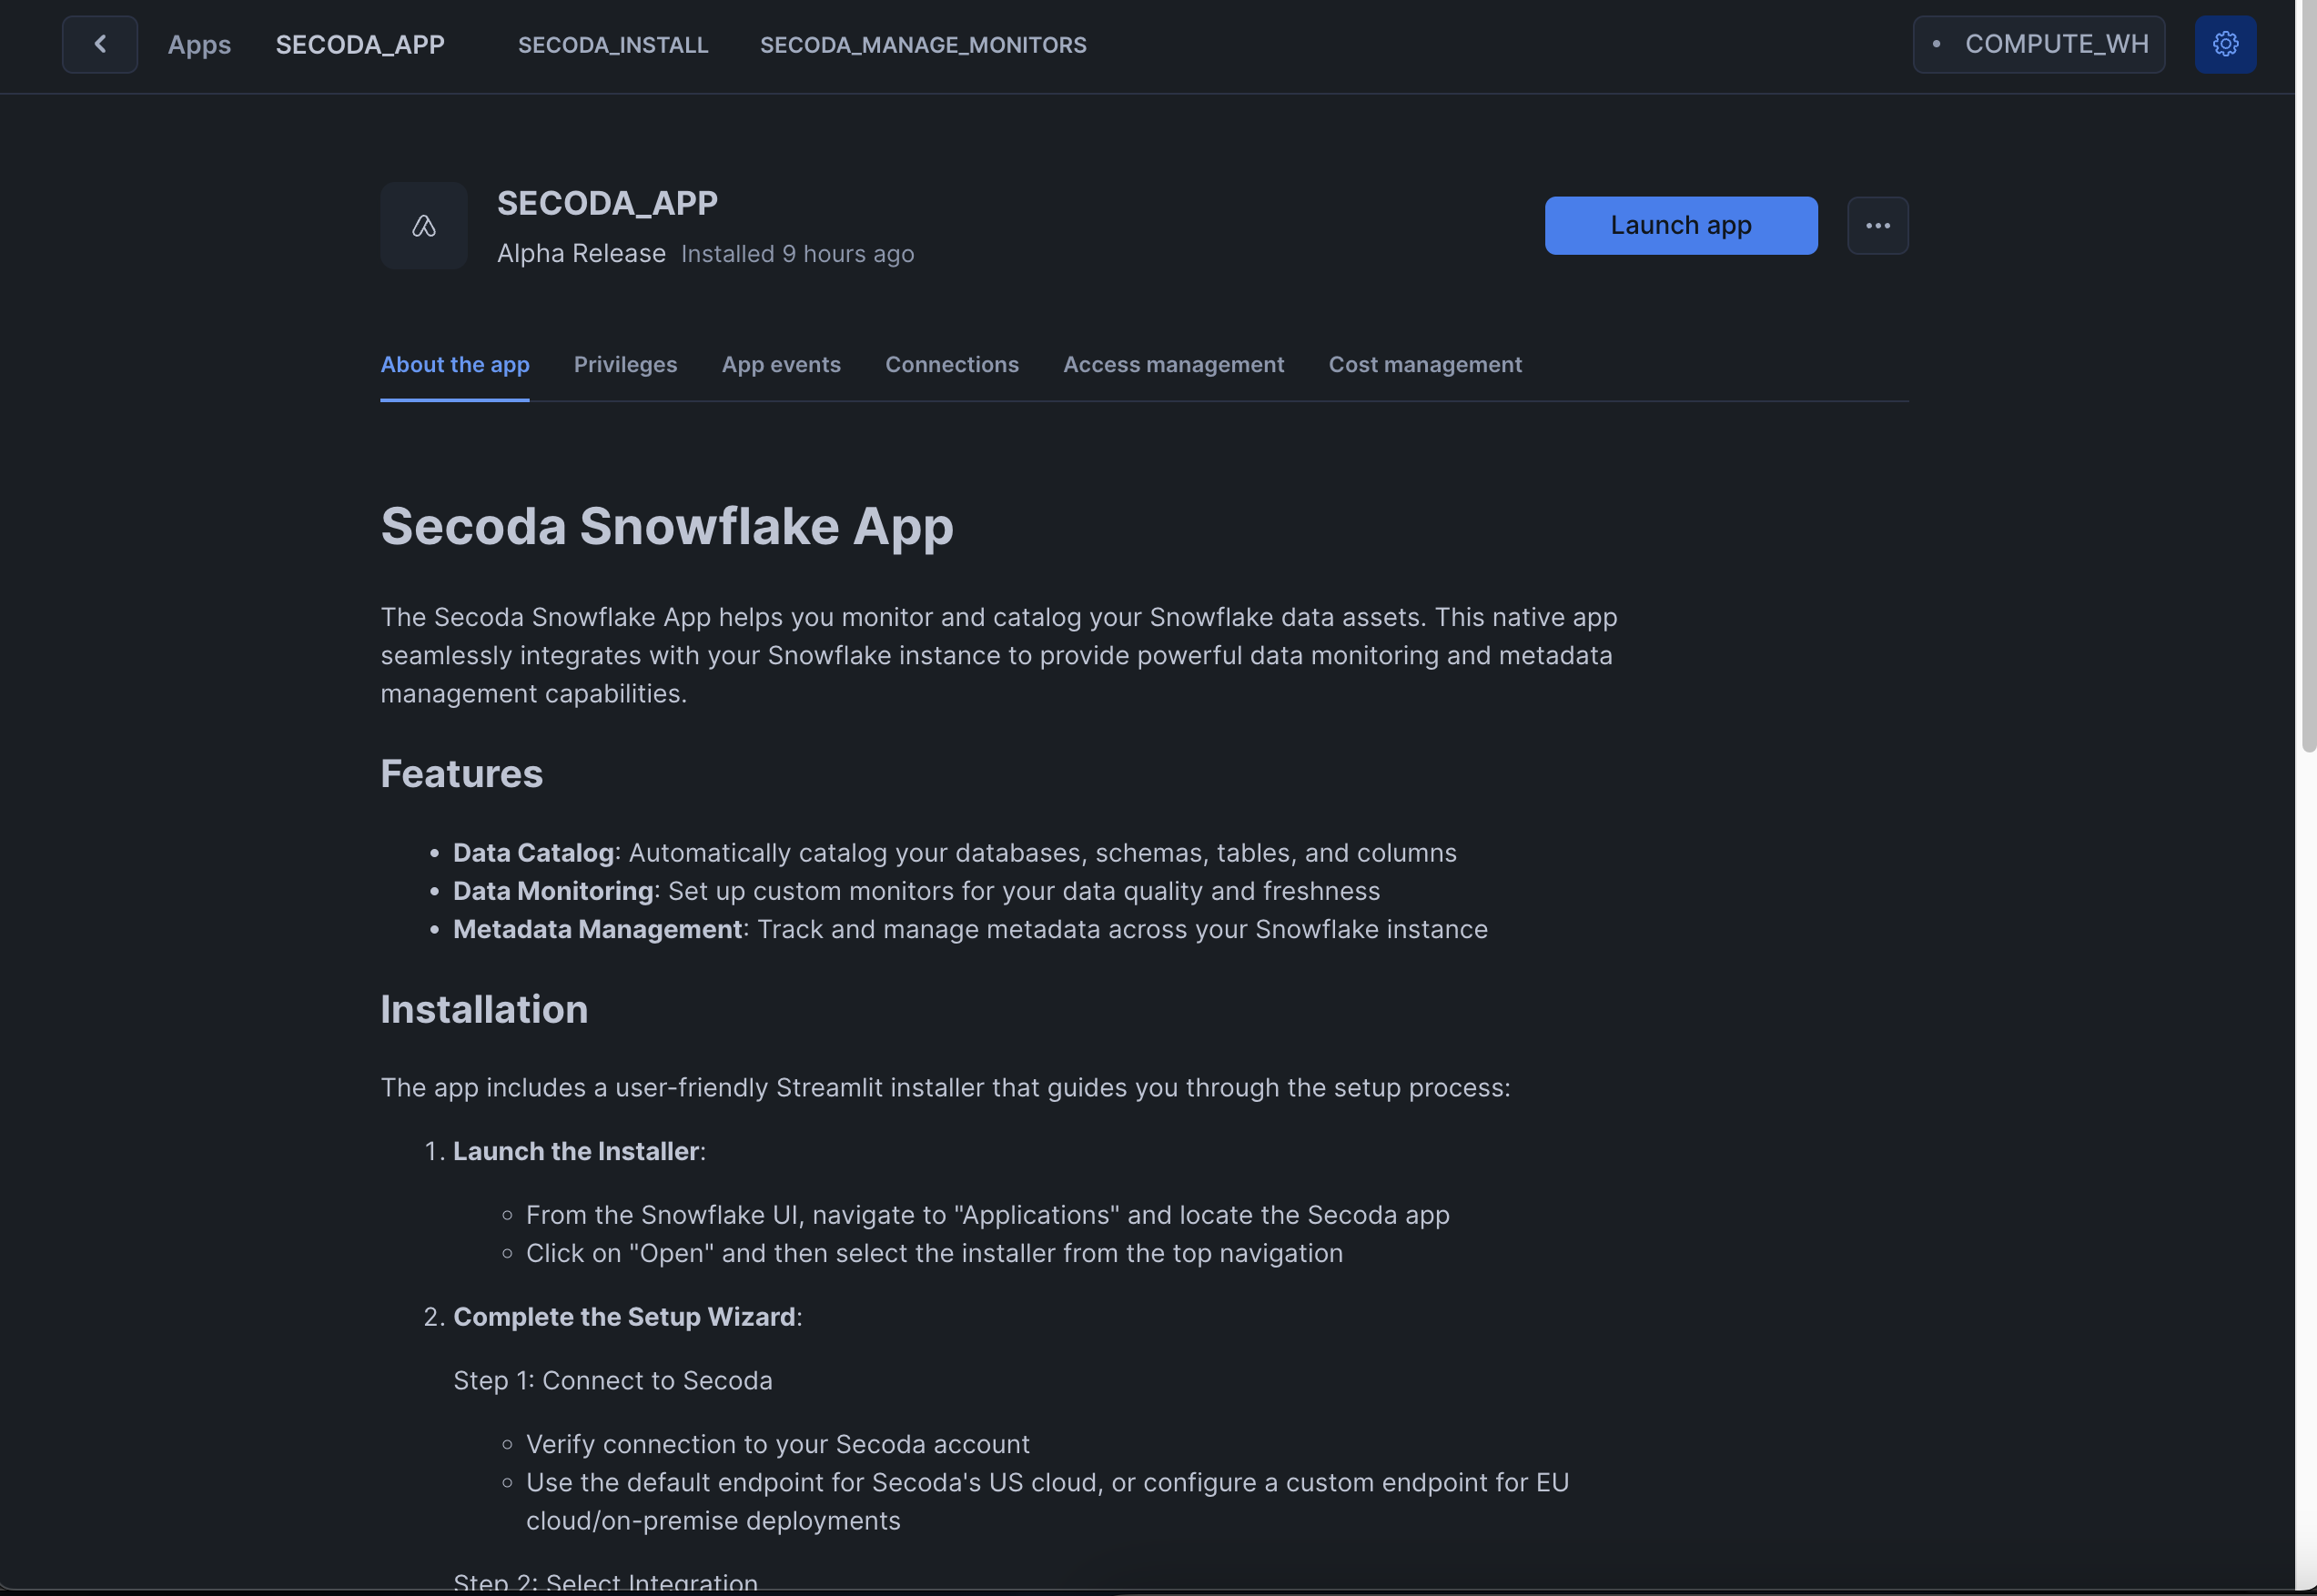
You can install the app directly from the Snowflake Marketplace. Once installed, you will see the application interface:
Secoda Native App Interface
### 2. Configure Connection Credentials
Next, you'll need to configure the connection and provide account-level privileges:
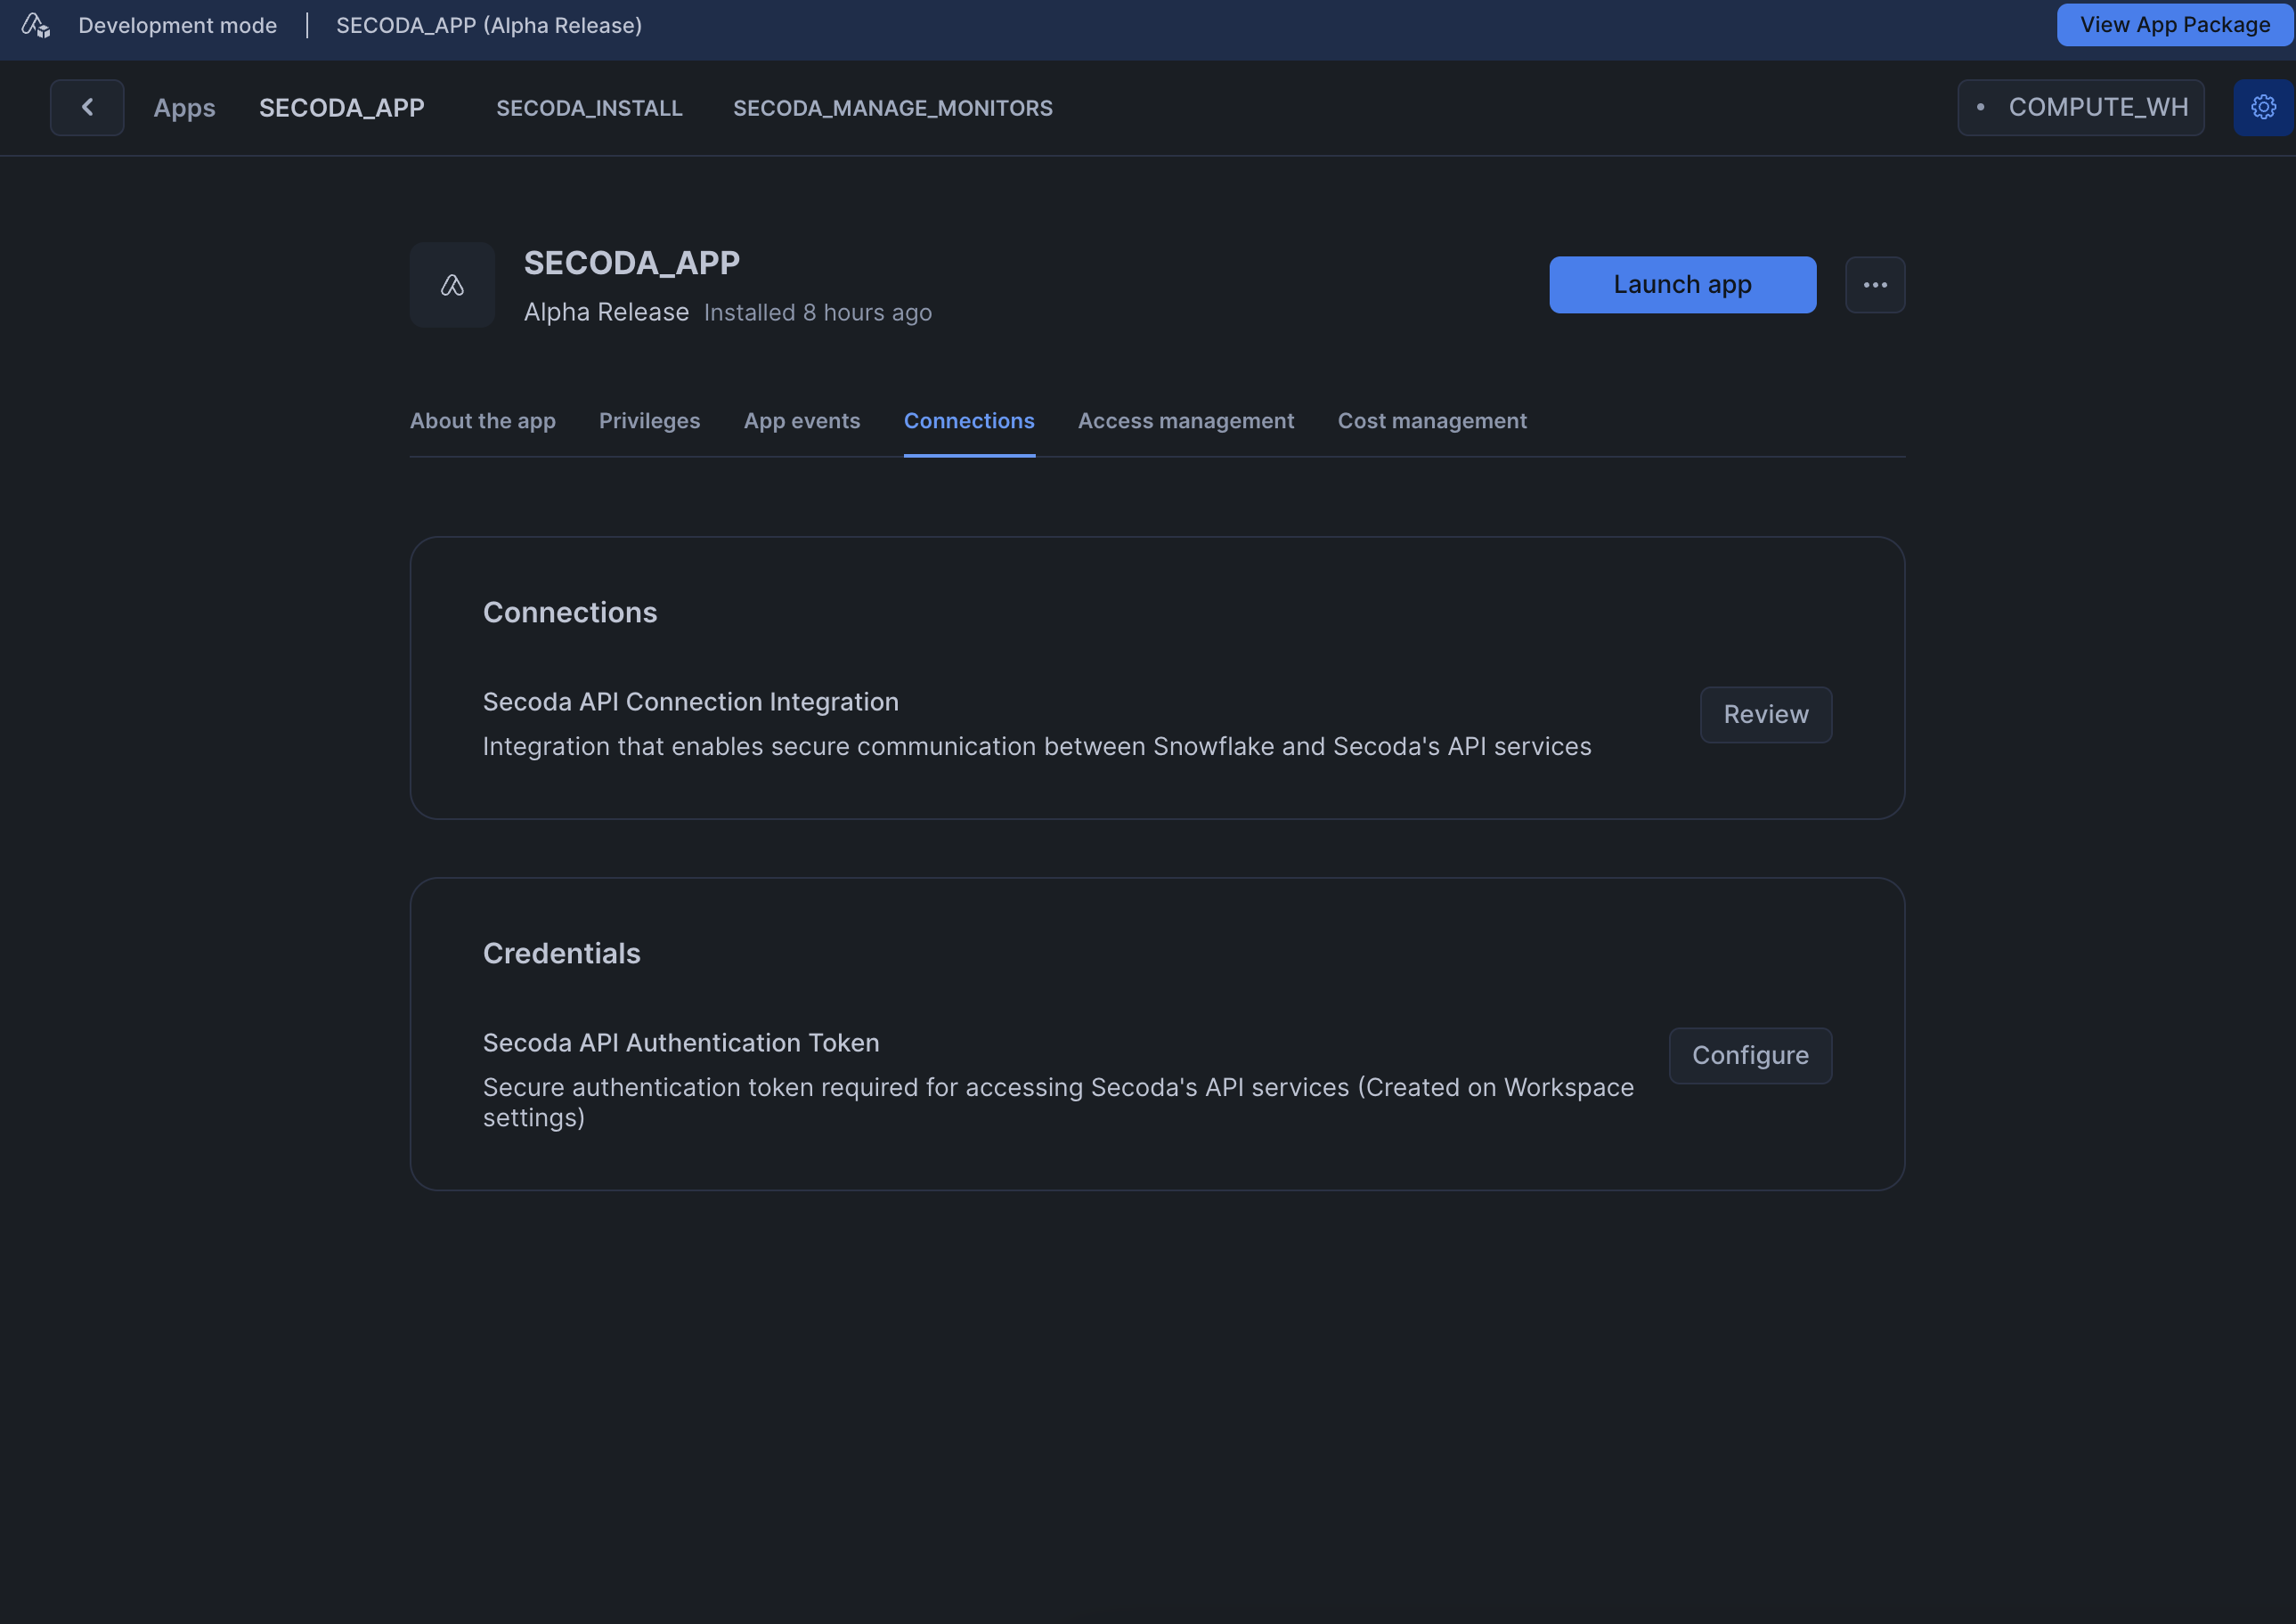
1. Open the app and navigate to the Connections tab
Connections Tab
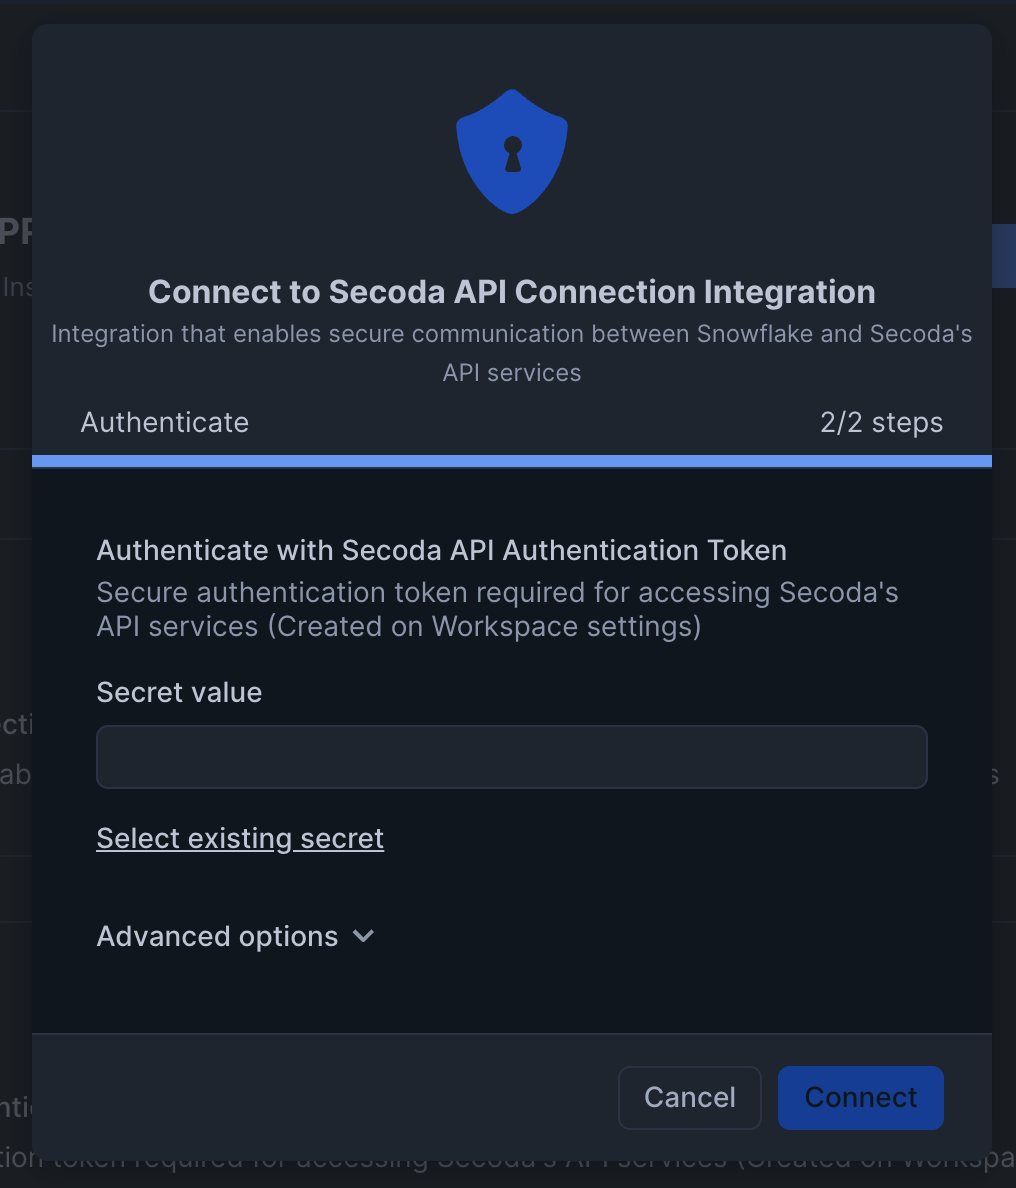
2. Enter your Secoda API key (You can generate an API key from your Workspace settings)
API Key Entry
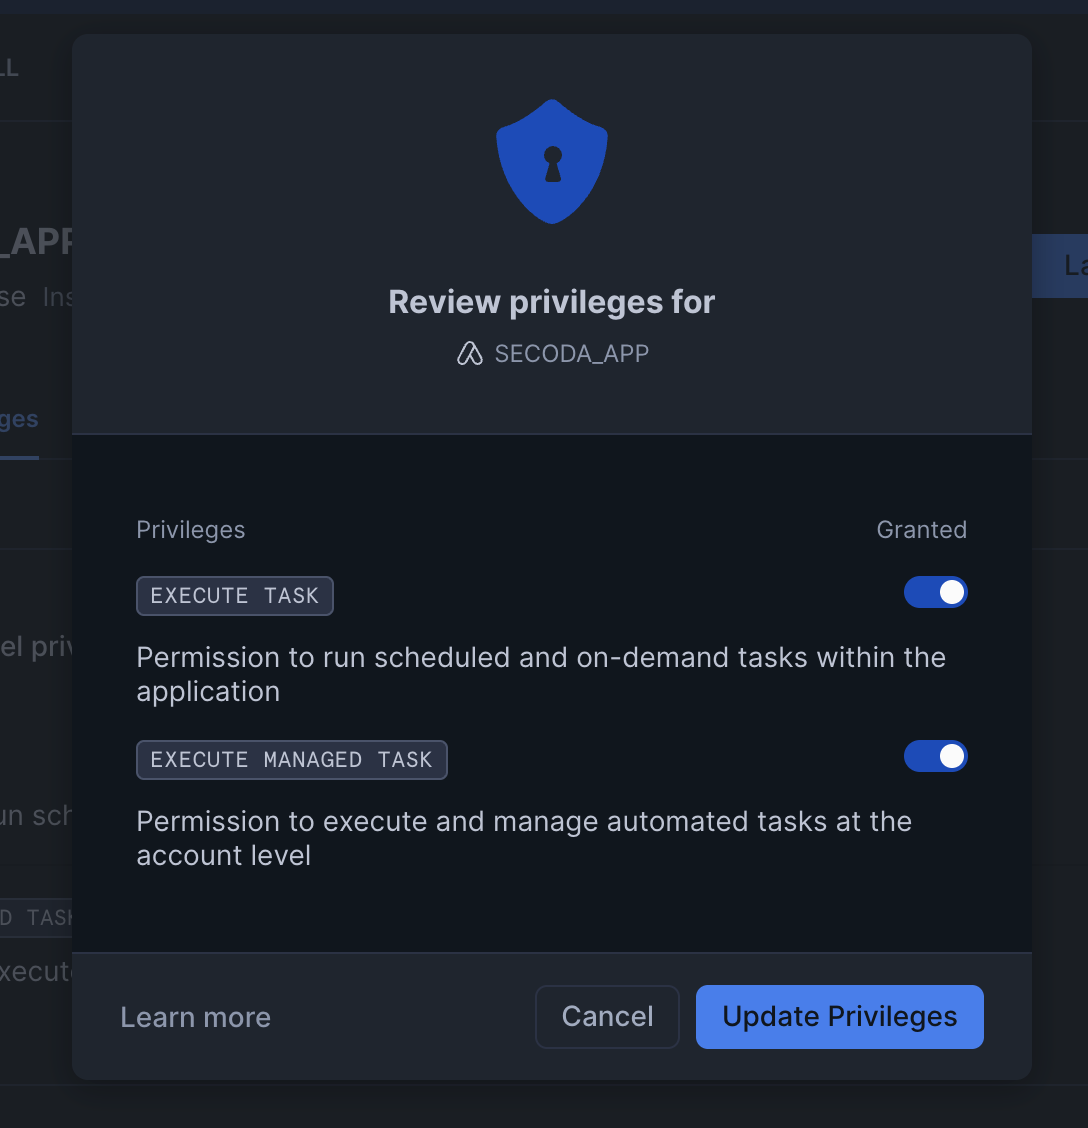
3. Grant the necessary privileges to the application
Required Privileges
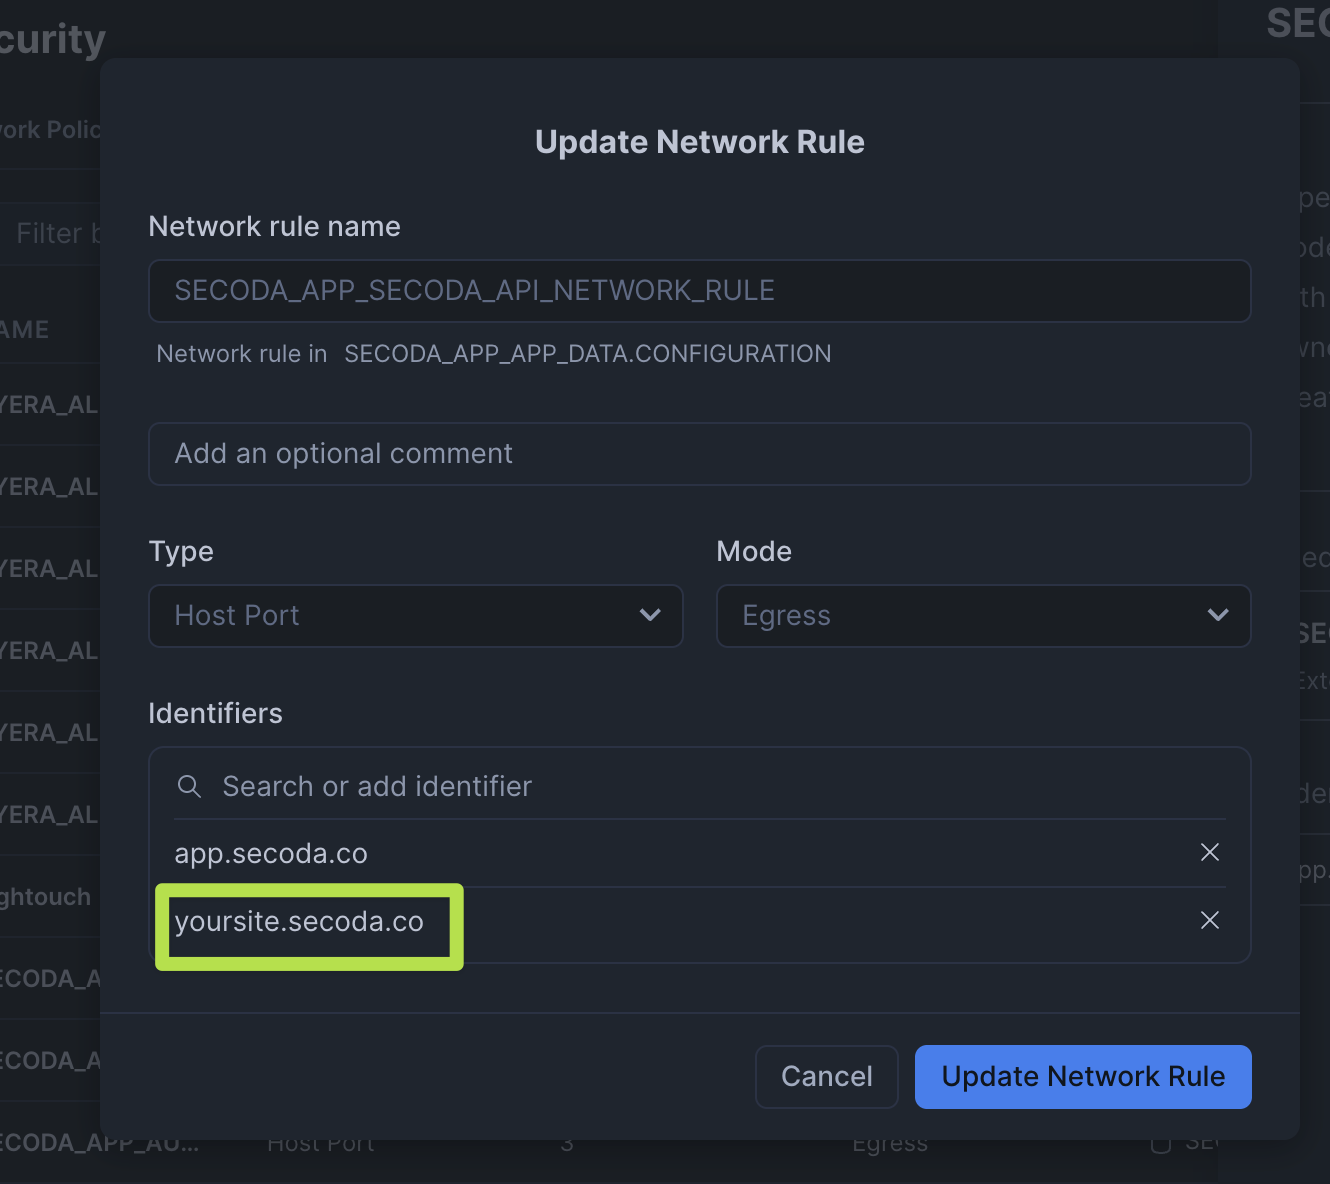
### 3. Network Rule Setup
By default, the native app can connect to Secoda's US Cloud service (app.secoda.co). If you use any other URL to access Secoda, you will need to create a network rule.
{% hint style="info" %}
You can skip this step if you use Secoda at app.secoda.co
{% endhint %}
To create a network rule:
1. In Snowflake, navigate to Admin → Security → Network Rules
2. The network rule name depends on your app installation name
* If you installed the app as `SECODA_APP`, the rule will be named `SECODA_APP_SECODA_API_NETWORK_RULE`
3. Add your custom Secoda endpoint to the network rule
Network Rule Configuration
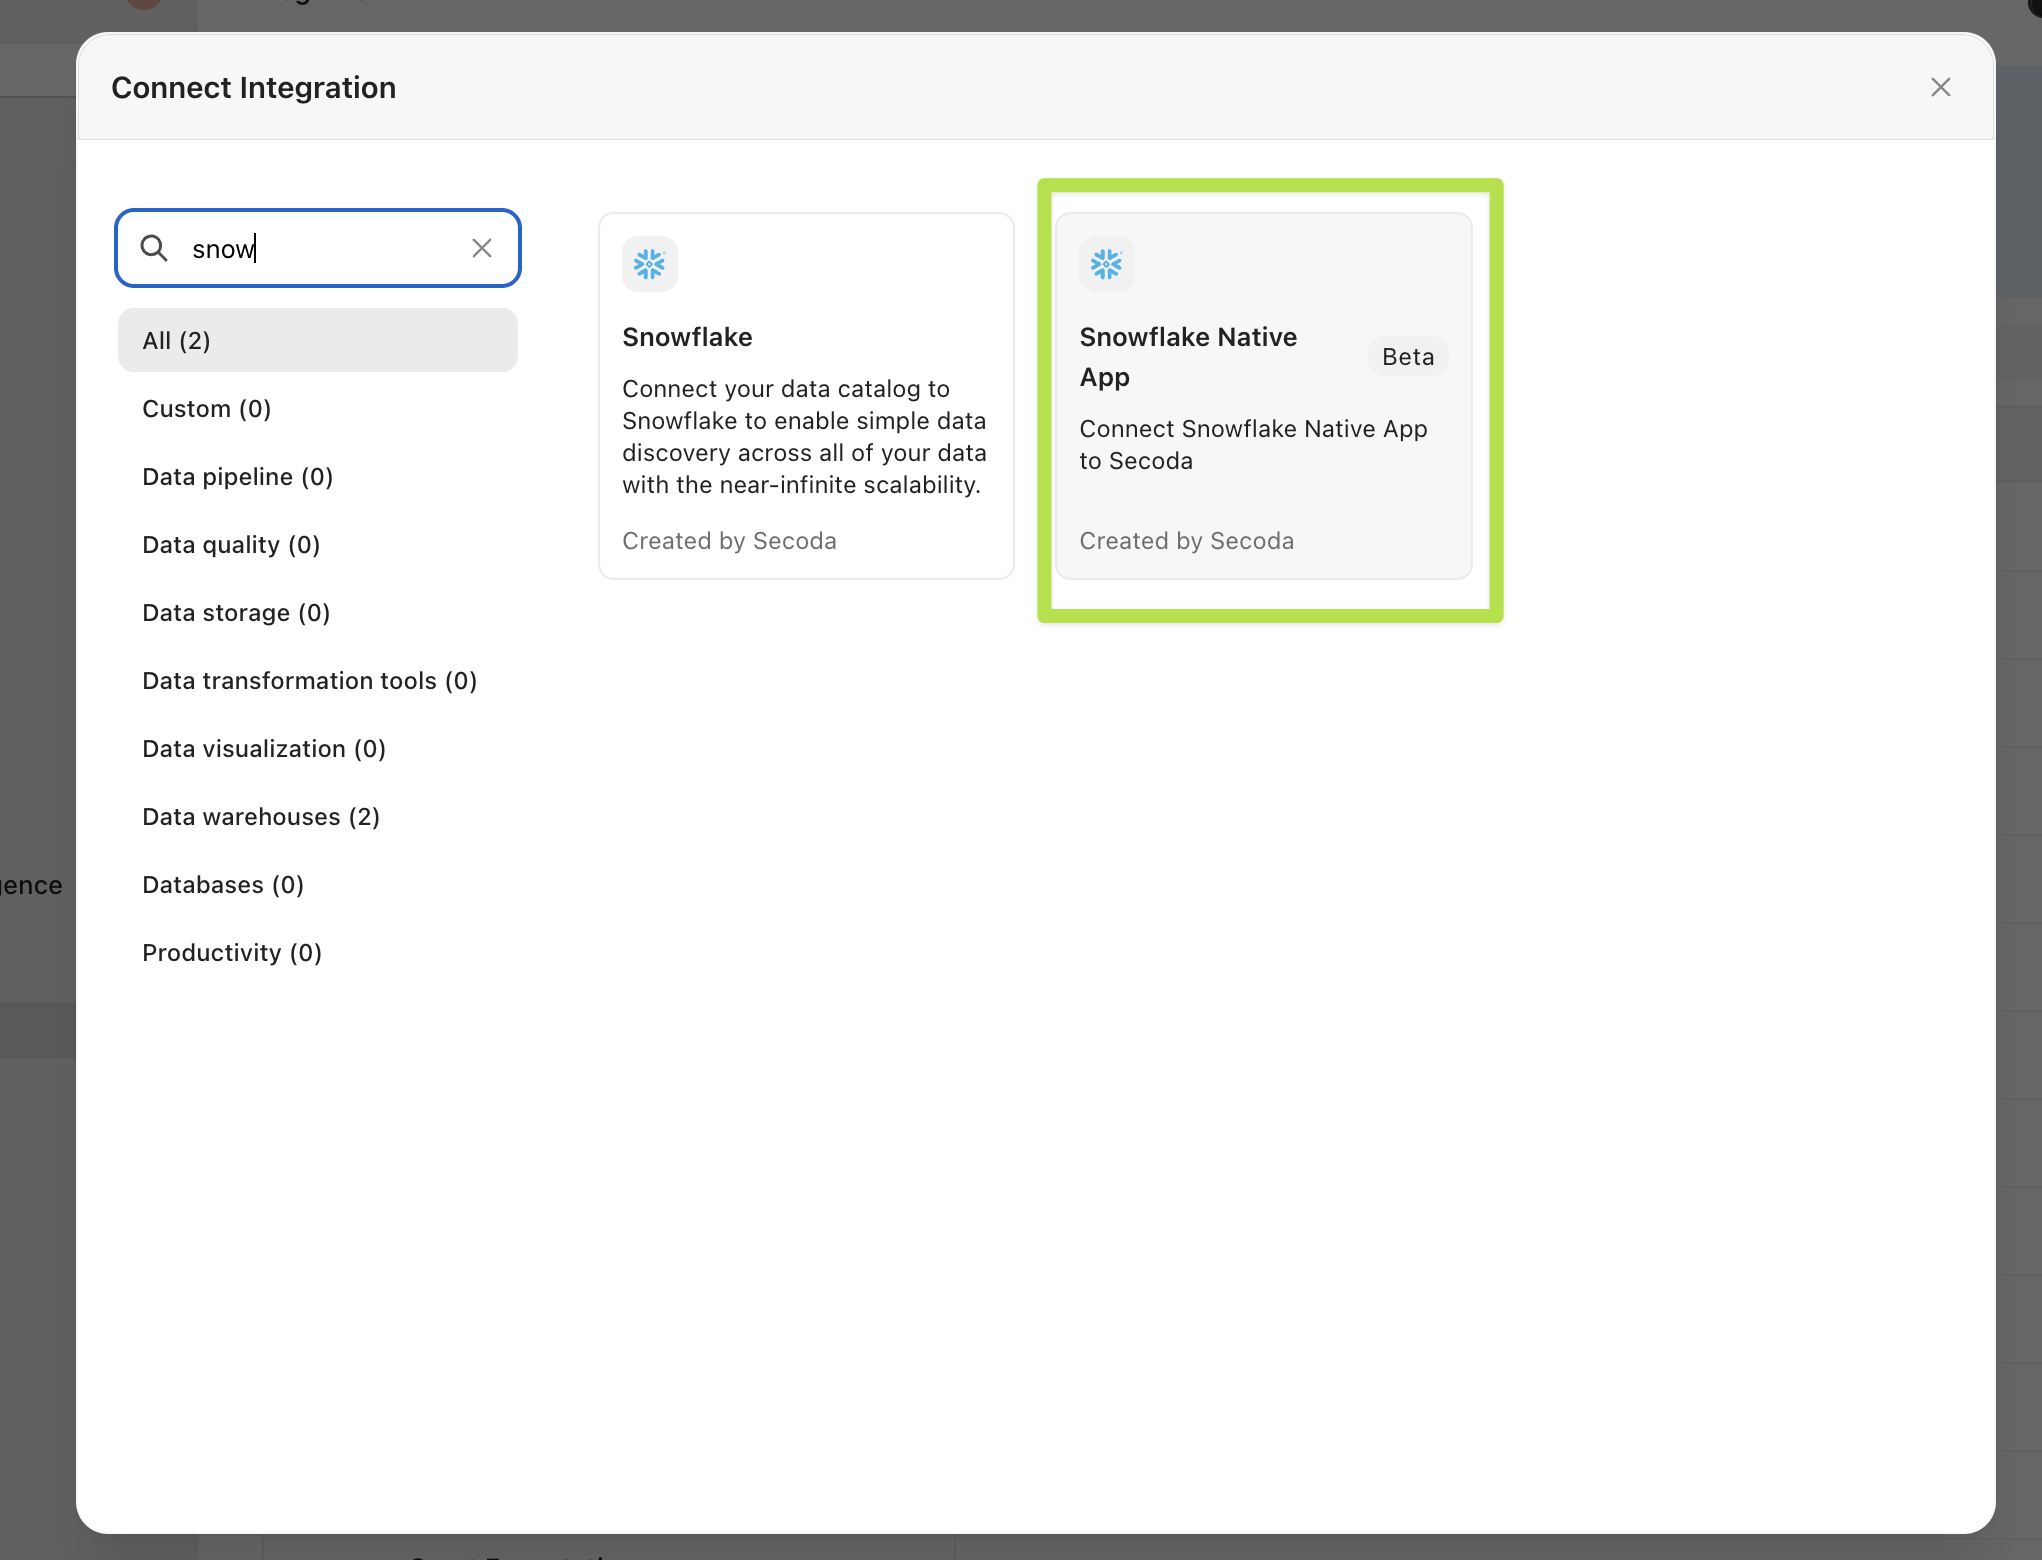
### 4. Create Integration in Secoda
Before proceeding with the application configuration, you need to create a Native Snowflake integration in Secoda:
Creating a Native Snowflake Integration in Secoda
You will not need to configure any authentication for this integration. After creating the integration in Secoda, return to Snowflake and launch the "INSTALL\_SECODA" Streamlit program from the application header.
## Setup Wizard
The setup process guides you through three essential steps:
### 1. Connect to Secoda
* By default, the installation connects to Secoda's US cloud (app.secoda.co)
* Custom endpoint options are available for EU cloud, single-tenant, or on-premise deployments
### 2. Select Integration
* Choose which Secoda integration to use with your Snowflake data
* The app will list compatible Snowflake integrations from your Secoda account
* If no integrations exist, you'll need to create one in Secoda first
### 3. Configure Features
* **Catalog**: Enable to discover, explore, and document your Snowflake data assets
* **Monitor**: Enable to track data quality and freshness metrics
{% hint style="success" %}
Once the setup is complete, your Secoda Native Snowflake App is ready to use!
{% endhint %}
## Using the Native App
You can interact with the Secoda Native Snowflake App in two ways:
1. **Streamlit-powered GUI**: A user-friendly interface for configuring and managing your integration
2. **SQL commands**: Execute SQL statements via a worksheet to perform the same operations
Most functionality available through the GUI can also be accessed via SQL commands, offering flexibility based on your team's preferences.
### Required Permissions
For each database you want to monitor or catalog, grant the following permissions:
```sql
-- Replace placeholders with your actual database, schema, and table names
GRANT USAGE ON DATABASE TO APPLICATION secoda_app;
GRANT USAGE ON SCHEMA . TO APPLICATION secoda_app;
GRANT SELECT ON TABLE .. TO APPLICATION secoda_app;
```
## Monitoring
The monitoring feature allows you to create data quality monitors that run within your Snowflake account using your Snowflake credits. Only the final calculated information is sent to Secoda.
Secoda tracks these metrics and can alert stakeholders when values exceed configured thresholds or when anomalies are detected.
### Creating Monitors
You can create monitors using SQL commands. Here are some common examples:
```sql
-- Basic row count monitor
CALL SECODA_APP.MONITORING.CREATE_MONITOR(
MONITOR_KEY => 'users_row_count',
NAME => 'Users Table Row Count',
METRIC_TYPE => 'row_count',
TABLE_CATALOG => 'your_database',
TABLE_SCHEMA => 'your_schema',
TABLE_NAME => 'your_table'
);
-- Column-based monitor with manual thresholds
CALL SECODA_APP.MONITORING.CREATE_MONITOR(
MONITOR_KEY => 'users_max_age',
NAME => 'Users Maximum Age',
METRIC_TYPE => 'max',
TABLE_CATALOG => 'your_database',
TABLE_SCHEMA => 'your_schema',
TABLE_NAME => 'your_table',
COLUMN_NAME => 'age',
THRESHOLDS_METHOD => 'manual',
THRESHOLDS_MAX => 100,
THRESHOLDS_MIN => 20
);
-- Custom SQL monitor
CALL SECODA_APP.MONITORING.CREATE_MONITOR(
MONITOR_KEY => 'active_users',
NAME => 'Count of Active Users',
METRIC_TYPE => 'custom_sql',
TABLE_CATALOG => 'your_database',
TABLE_SCHEMA => 'your_schema',
TABLE_NAME => 'your_table',
QUERY => 'SELECT COUNT(*) FROM your_database.your_schema.your_table WHERE is_active = TRUE'
);
-- Freshness monitor
CALL SECODA_APP.MONITORING.CREATE_MONITOR(
MONITOR_KEY => 'data_freshness',
NAME => 'Data Freshness',
METRIC_TYPE => 'freshness',
TABLE_CATALOG => 'your_database',
TABLE_SCHEMA => 'your_schema',
TABLE_NAME => 'your_table',
COLUMN_NAME => 'last_updated'
);
```
### Running and Managing Monitors
To run a specific monitor:
```sql
CALL SECODA_APP.MONITORING.RUN_MONITOR('monitor_key');
```
You can also manage your monitors:
```sql
-- Pause a monitor
CALL SECODA_APP.MONITORING.PAUSE_MONITOR('monitor_key');
-- Resume a monitor
CALL SECODA_APP.MONITORING.RESUME_MONITOR('monitor_key');
-- Update a monitor's thresholds
CALL SECODA_APP.MONITORING.UPDATE_MONITOR(
MONITOR_KEY => 'monitor_key',
THRESHOLDS_METHOD => 'manual',
THRESHOLDS_MAX => 100
);
-- Clear all monitors
CALL SECODA_APP.MONITORING.CLEAR_MONITORS();
```
## Catalog
The Catalog feature automatically discovers and syncs metadata about all schemas, tables, and columns that the app has been granted access to. The catalog syncs automatically at 12 AM UTC daily. After the sync completes, it may take a few hours for the metadata to be available in Secoda.
### Manual Catalog Sync
You can also manually trigger a catalog sync:
1. Open the "MANAGE\_CATALOG" Streamlit application
2. Click "Push Catalog" to start the sync process
3. Once complete, go to Secoda and open the integration page
4. Click "Pull Metadata" to import the metadata into Secoda
{% hint style="info" %}
The catalog sync process takes approximately 1 hour for 200 tables and runs in a managed XSMALL warehouse.
{% endhint %}
---
# Agent Instructions
This documentation is published with GitBook. GitBook is the documentation platform designed so that both humans and AI agents can read, navigate, and reason over technical content effectively. Learn more at gitbook.com.
## Querying This Documentation
If you need additional information that is not directly available in this page, you can query the documentation dynamically by asking a question.
Perform an HTTP GET request on the current page URL with the `ask` query parameter, and the optional `goal` query parameter:
```
GET https://docs.secoda.co/integrations/data-warehouses/snowflake-integration/native-snowflake.md?ask=&goal=
```
`ask` is the immediate question: it should be specific, self-contained, and written in natural language.
`goal` is optional and describes the broader end goal you are ultimately trying to accomplish on behalf of the user. GitBook uses it to tailor the answer towards what is most useful for that goal.
The response will contain a direct answer to the question and relevant excerpts and sources from the documentation.
Use this mechanism when the answer is not explicitly present in the current page, you need clarification or additional context, or you want to retrieve related documentation sections.